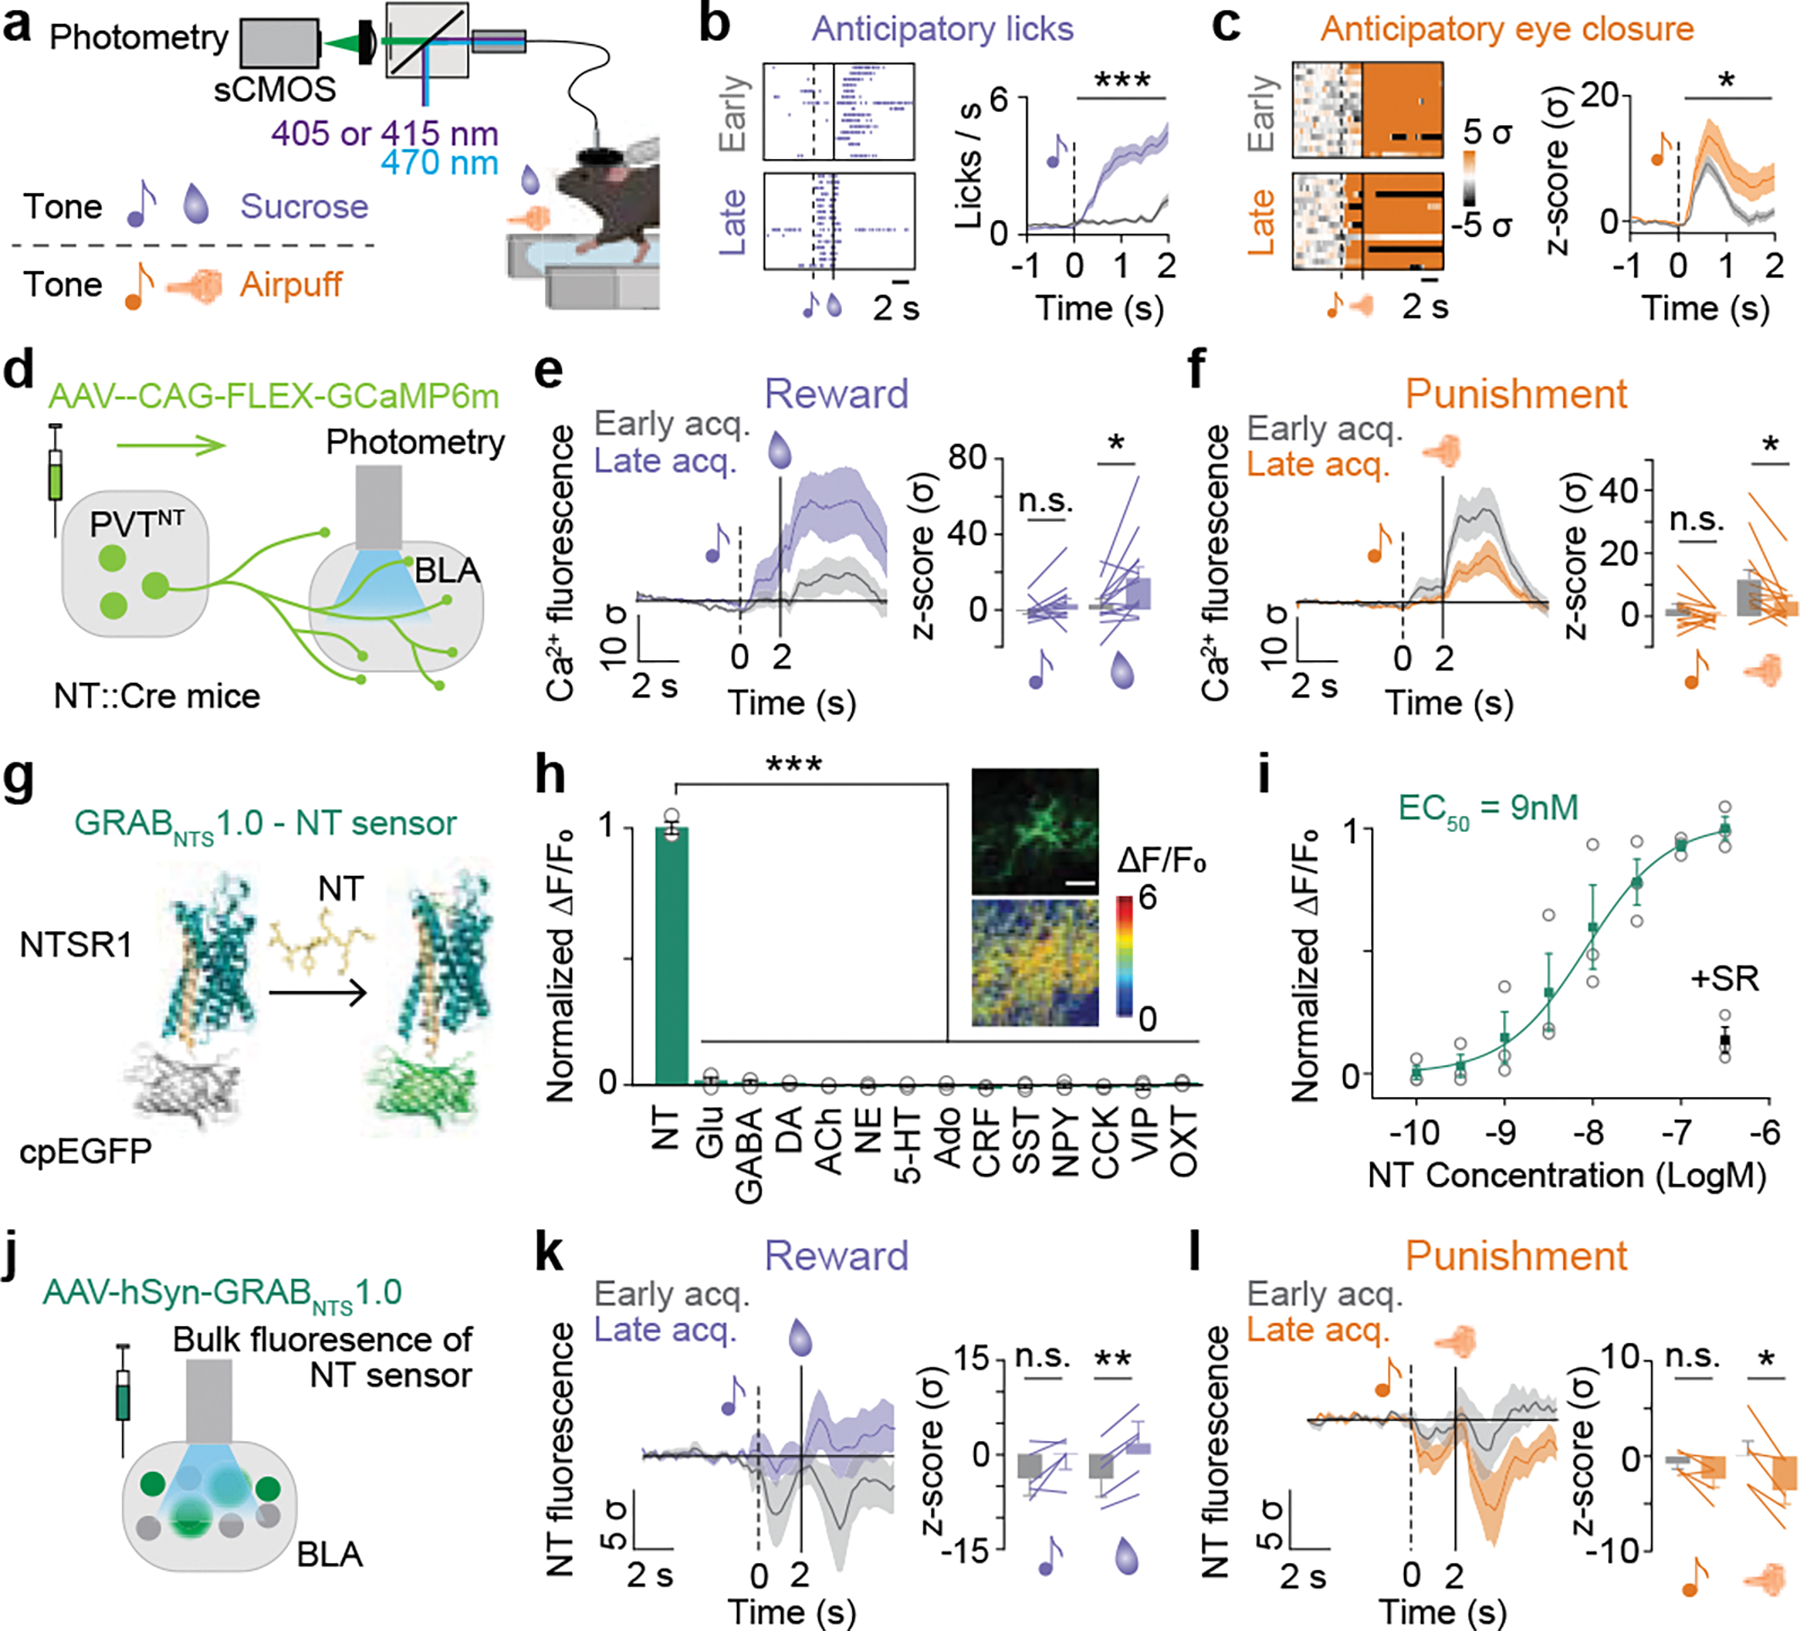
Figure 3: Genetically-encoded fluorescent sensors reveal enhanced and suppressed NT dynamics in the BLA after reward and punishment learning, respectively.

(a) Schematics of fiber photometry recording and behavioral paradigm of head-fixed associative learning. (b) Representative plots of licks (Left) and averaged anticipatory licks to the sucrose tone for the first 16 trials of first and last tone-sucrose sessions (Right; Two-tailed paired t-test; ***P<0.0001, N=13). (c) Representative plots of normalized eye closure index (Left) and averaged anticipatory eye closure to the airpuff tone for the first 16 trials of first and last tone-airpuff conditioning sessions (Right; Two-tailed paired t-test; *P=0.03, N=12). (d) Schematic of viral injection of a genetically-encoded calcium indicator and fiber implantation. (e) Calcium responses of the PVT-BLA:NT axon terminals to sucrose were significantly enhanced by reward conditioning (Two-tailed paired t-test, CS: P=0.1663; US: *P=0.0125; N=13). (f) Responses to airpuff were significantly suppressed by punishment conditioning. (Two-tailed paired t-test, CS: P=0.169; US: *P=0.0145; N=12). (g) Schematic drawing of the GRABNTS1.0 sensor. The third intracellular loop of the human NTSR1 was replaced with cpEGFP, thus the binding of neurotensin induces a conformational change that increases the intensity of cpEGFP fluorescence. (h) Normalized ΔF/F0 in sensor-expressing neurons following the application of NT alone, glutamate (Glu), gamma-aminobutyric acid (GABA), dopamine (DA), acetylcholine (ACh), norepinephrine (NE), serotonin (5-HT), adenosine (Ado), corticotrophin releasing factor (CRF), somatostatin (SST), neuropeptide Y (NPY), cholecystokinin (CCK), vasoactive intestinal peptide (VIP) and oxytocin (OXT; One-way ANOVA with Dunnett’s multiple comparisons test; ***P<0.0001). Inset: representative images of sensor expression (top) and responses to 100 nM NT (down) in cultured neurons. Scale bar represents to 100 μm. (i) Normalized dose-response curve for GRABNTS1.0 expressing neurons in response to NT, and the black dot indicates subsequent addition of 1 μM NTSR1 (+SR) antagonist at the 300 nM NT condition. (j) Schematic of viral injection of a genetically-encoded NT sensor and fiber implantation. (k) BLA NT sensor response to sucrose was enhanced by reward conditioning (Two-tailed paired t-test, CS: P=0.1483; US: **P=0.001; N=5). (l) BLA NT sensor response to airpuff was reduced by punishment conditioning (Two-tailed paired t-test, CS: P=0.0994; US: *P=0.0162; N=5). Analysis windows for the CSs and the USs were 0–2s and 2–7s from CS onsets, respectively. N denotes number of mice in each group. Error bars and solid shaded regions around the mean indicate s.e.m.
