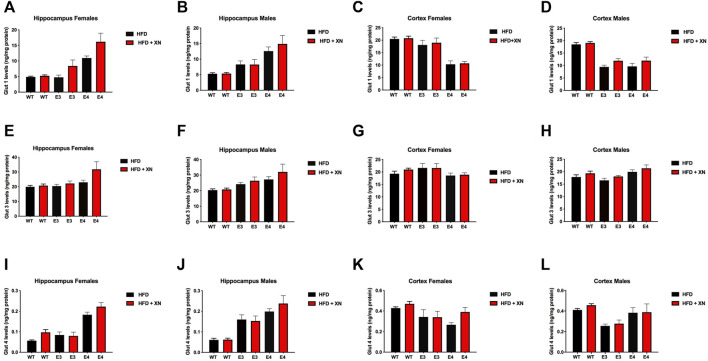
FIGURE 5.
Protein levels of GLUT1 (A–D), GLUT3 (E–H), and GLUT4 (I–L) glucose transporters in the hippocampus (A,B,E,F,I,J) and cortex (C,D,G,H,K,L). All graphs show the mean ± SEM. XN-treated mice had higher glucose transporter protein levels in the hippocampus and cortex than HFD only-treated mice, with the exception of E3 mice. Among the 12 sex-genotype-site combinations for each of the 3 glucose transporters, XN-treated mice had for 31 of 36 comparisons higher levels than HFD only-treated mice (sign test: p < 0.0001). In all WT and E4 mice comparisons, XN-treated mice had higher levels, whereas in 5 of 12 E3 mice comparisons, HFD only-treated mice had higher levels. The XN-effect was significant for Glut1 (p = 0.01) and Glut3 (p = 0.02) in the hippocampus and tended to be significant for Glut 4 (p = 0.075) in the hippocampus and for Glut 3 (p = 0.095) and Glut 4 (p = 0.08) in the cortex. E4 mice had higher glucose transporter protein levels in the hippocampus and lower glucose transporter protein levels cortex than WT mice. In all 4 sex-treatment comparisons for each of the 3 glucose transporters, E4 mice had higher glucose transporter protein levels in the hippocampus (sign test: p = 0.0005), and in 10 of 12 comparisons, E4 mice had lower glucose transporter protein levels in the cortex (p = 0.04) than WT mice. E3 mice also had higher glucose transporter protein levels in the hippocampus and lower glucose transporter protein levels cortex than WT mice. In 10 of 12 comparisons, E4 mice had higher glucose transporter protein levels in the hippocampus (sign test: p = 0.04) and lower glucose transporter protein levels in the cortex (sign test: p = 0.04) than WT mice. Female and male E4 mice had higher glucose transporter protein levels in the hippocampus and female E4 mice had lower glucose transporter protein levels in the cortex than female E3 mice in all 18 comparisons (sign test: p < 0.0001). The exception were cortical levels in male E4 mice, which were higher in 5 of 6 E4 vs. E3 comparisons (Fisher’s exact test: p = 0.0007). Male mice had higher glucose transporter protein levels in the hippocampus than female mice in 14 of 18 comparisons (p = 0.03) and lower glucose transporter protein levels in the cortex than female mice in all 12 WT and E3 comparisons (sign test: p = 0.0005). The exception were glucose transporter protein levels in the cortex of male E4 mice, which were higher in 5 of 6 E4 comparisons with female E4 mice (Fisher’s exact test: p = 0.0007).

