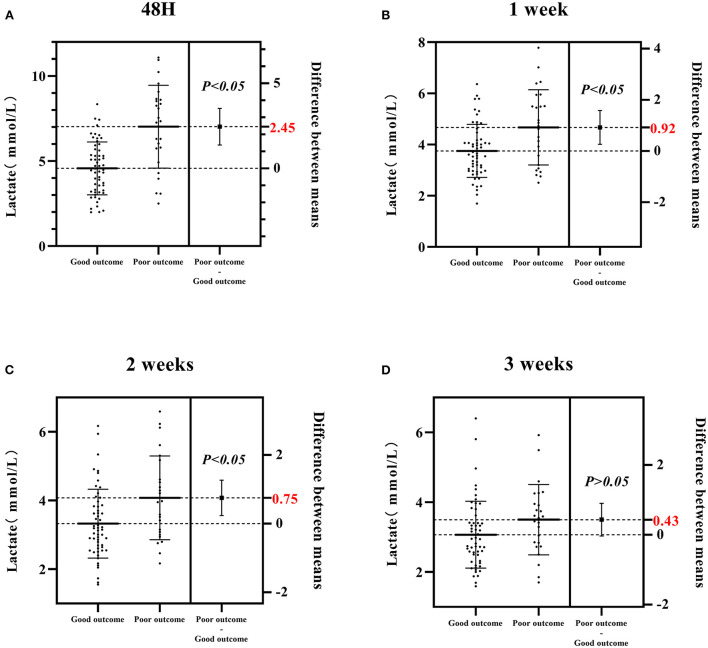
Figure 2.
Differences in the CSF lactate level between poor and good outcome groups at four different time points (48 h, 1, 2, 3 weeks) after admission. (A) The CSF lactate level in poor and good outcome groups at 48 h after admission. (B) The CSF lactate level in poor and good outcome groups at 1 week after admission. (C) The CSF lactate level in poor and good outcome groups at 2 weeks after admission. (D) The CSF lactate level in poor and good outcome groups at 3 weeks after admission. Good outcome was defined as a modified Rankin scale (mRs) score of 0–2; poor outcome was defined as a mRS score of 3–6.

