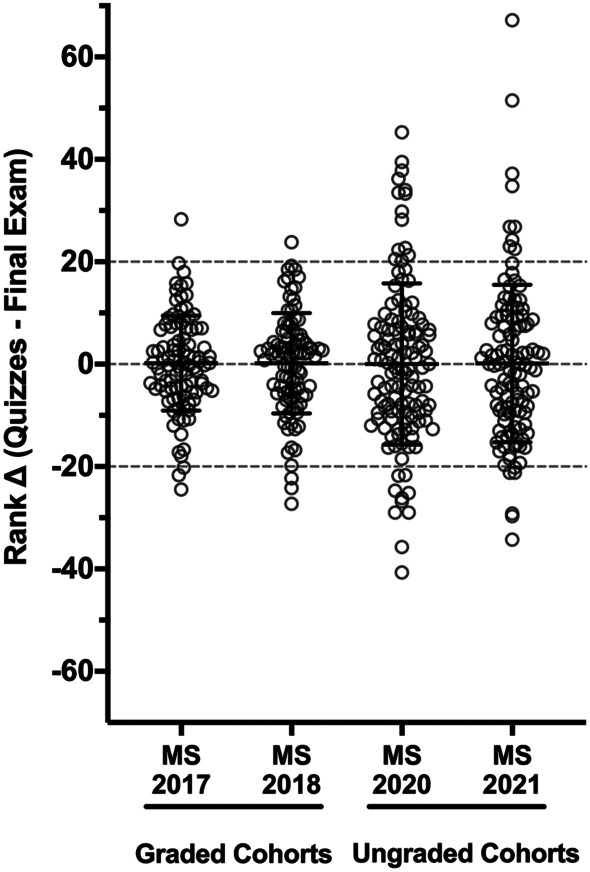
Fig. 4.

The mean and standard deviation for the change in rank (rank ∆ = average class ranking for quizzes minus the class ranking on the final exam) for each of the four cohorts in the study period at University of Utah School of Medicine. This is based on the assumption that all students would give their full effort on all assessments. Positive change values indicate improved performance relative to peers on the final exam compared to the ungraded quizzes, possibly suggesting decreased effort on the quizzes. The spread of the distribution of this metric increased in the ungraded quiz cohorts as measured by the standard deviation, indicating that ungraded quizzes did affect behavior. However, the absolute number of students outside the arbitrarily chosen gates of plus or minus 20 points was small
