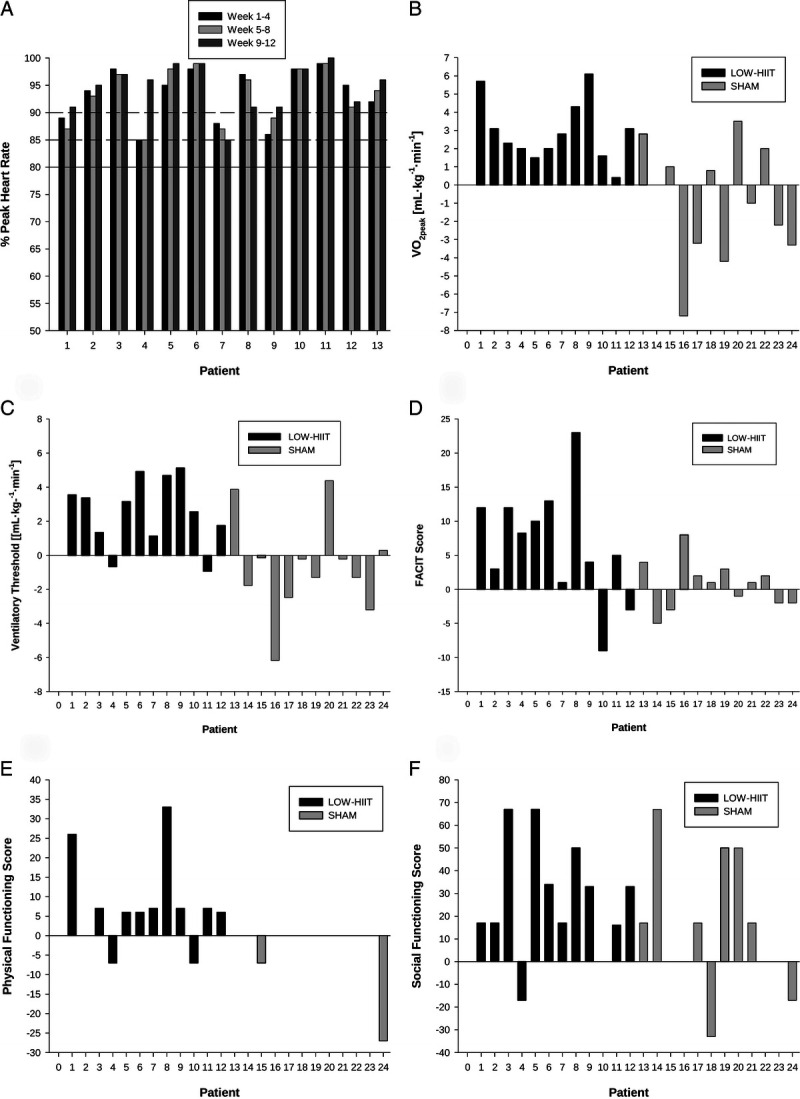
FIGURE 5.

Individual heart rate responses and chronic adaptations to LOW-HIIT. Individual mean heart rate responses during exercise intervals in weeks 1 to 4, weeks 5 to 8, and weeks 9 to 12 (full line indicates minimum required heart rate [≥80% HRpeak), dashed lines indicate lower bounds of the intended heart rates for weeks 5 to 8 [≥85% HRpeak] and week 9 to 12 [≥90% HRpeak] (A), individual changes in maximal oxygen uptake (B), individual changes in VT (C), individual changes in FACIT score (D), individual changes in physical functioning (E), and individual changes in social functioning (F).
