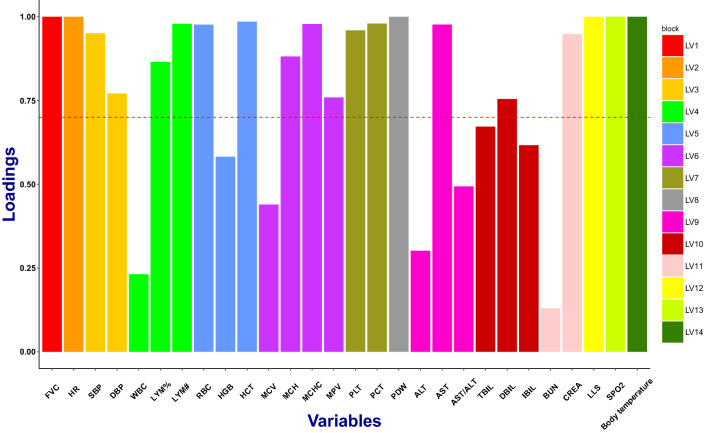
Fig. 3.
The PLSPM loadings of 14 composite phenotypes of high-altitude acclimatization. The 14 composite phenotypes (LV1, LV2… LV14) are represented by 14 different colors, and the height of each colorful bar is the loading (correlation) of each composite phenotype. Acceptable values for the loadings are values greater than 0.7 (threshold line), indicating that more than 49% (0.7×0.7) of the variability in a single phenotype (like SBP or DBP) is captured by its composite phenotype (like LV3)

