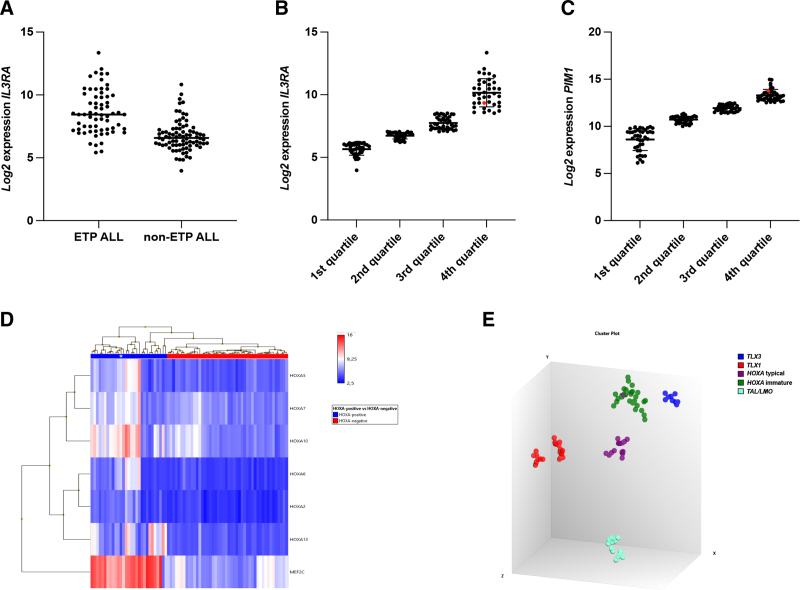
Figure 2.
Gene expression studies. (A) IL3RA expression in ETP-ALL and non-ETP-ALL cases; (B) Distribution of 159 T-ALL cases into quartiles according to IL3RA expression. The index case belongs to the fourth quartile (red dot); (C) Distribution of 159 T-ALL cases into quartiles according to PIM1 expression. The index case belongs to the 4th quartile (red dot); (D) The index case (white asterisk) shows high expression levels of MEF2C and HOXA, and (E) clusters with HOXA-positive T-ALL with an immature phenotype (HOXA immature) (green dot marked with purple strokes). ASI = applied spectral imaging; ETP-ALL = early T-cell precursor acute lymphoblastic leukemia; T-ALL = T-cell acute lymphoblastic leukemia.

