Fig. 1.
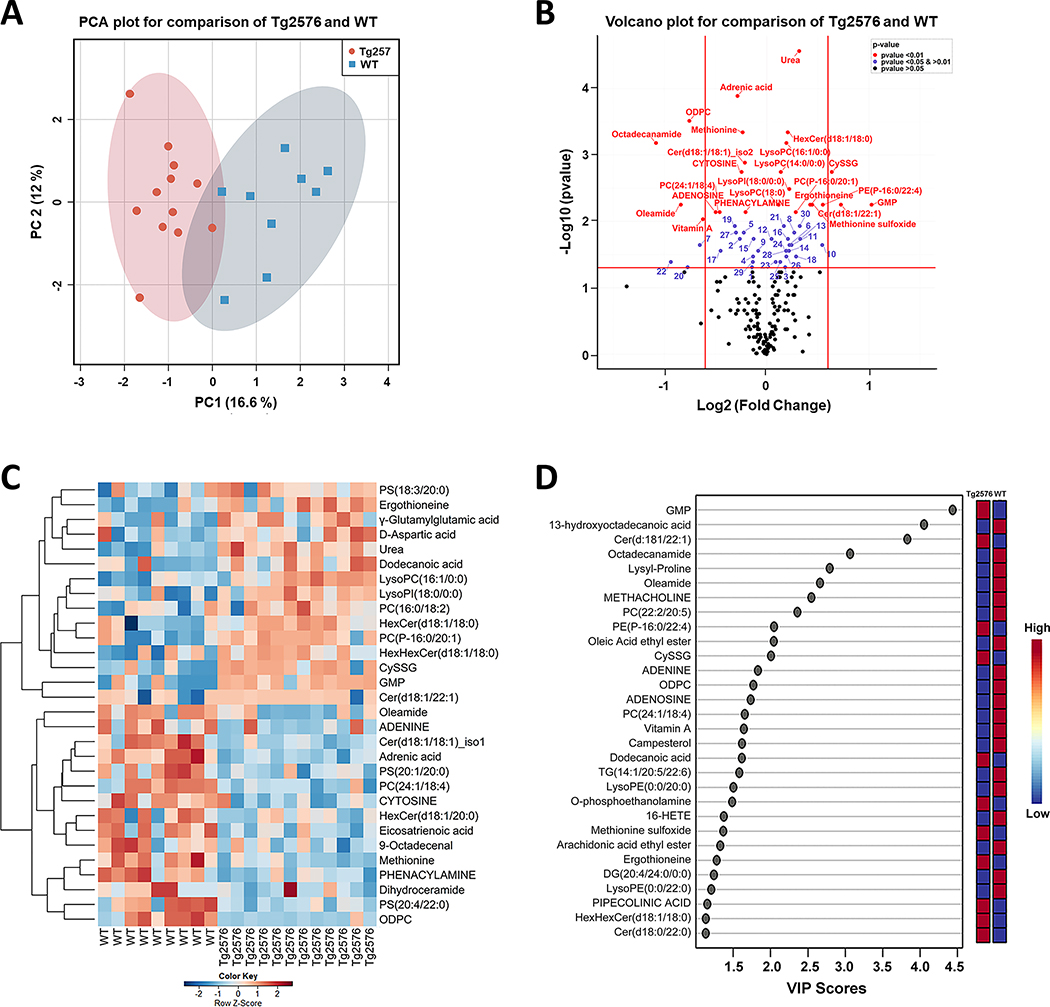
Integration of metabolomics information of Tg2576 and WT mice hippocampi to evaluate the impact of hAPP695SW transgene on metabolites level. A) PCA 2D score plot shows a clear separation between the hippocampal metabolome of Tg2576 and WT mice. B) Volcano plot summarizes the results of the univariate analysis showing 54 metabolites with a statistically significant difference between genotypes. The x-axis shows cut off values of − 0.6 < log2 (fold change) < 0.6; red, blue, and black dots indicate the metabolites with p-value < 0.01, 0.01 < p-value < 0.05 and p-value > 0.05, respectively. Numbers mark metabolites with p-value < 0.01 (comparing Tg2576 to WT hippocampi): 1: 4-O-Galactopyranosylxylose, 2:5-AMINOPENTANOATE, 3:5’-METHYLTHIOADENOSINE, 4:9-Octadecenal, 5:Eicosatrienoic acid, 6:Acetylcholine, 7:ADENINE, 8:D-Aspartic acid, 9:DESMOSTEROL, 10:Dodecanoic acid, 11:g-Glutamylglutamic acid, 12:GLUTAMIC ACID, 13:GLUTATHIONE, 14:Homoanserine, 15:LEUCINE, 16:LysoPC(18:2), 17:LysoPE(0:0/20:0), 18:N-ACETYL-L-ASPARTIC ACID, 19:Cer(d18:1/16:0), 20:Oleic Acid ethyl ester, 21:PC(16:0/18:2), 22:PC(22:2/20:5), 23:PC(22:6/18:2), 24:PC(P-16:0/22:1), 25: LysoPE(P-16:0/0:0), 26:PS(18:3/20:0), 27:PS(20:4/22:0), 28:TG(18:4/18:3/18:4), 29:Dihydroceramide, 30:HexHexCer(d18:1/18:0). C) Hierarchical clustering heatmap of the 30 most important metabolites responsible for classification based on MDA values found by random forest analysis. The heatmap was colored based on row Z-scores. Positive Z-score values are shown in red while negative Z-score values are shown in blue. D) Variable importance in projection (VIP) scores results using PLS-DA analysis showing the 30 most important discriminatory metabolites. Ten metabolites are in common in both D and E plots.
Level 1 annotations (metabolites with capitalized letter) were obtained from an in-house compound library consisting of >650 authentic standards (MSMLS, IROA Technology, Bolton, USA). Additional annotations (L2) were obtained by querying and comparison with spectral data from METLIN, LipidBlast and HMDB (online versions, August 2019) using Progenesis QI™.

