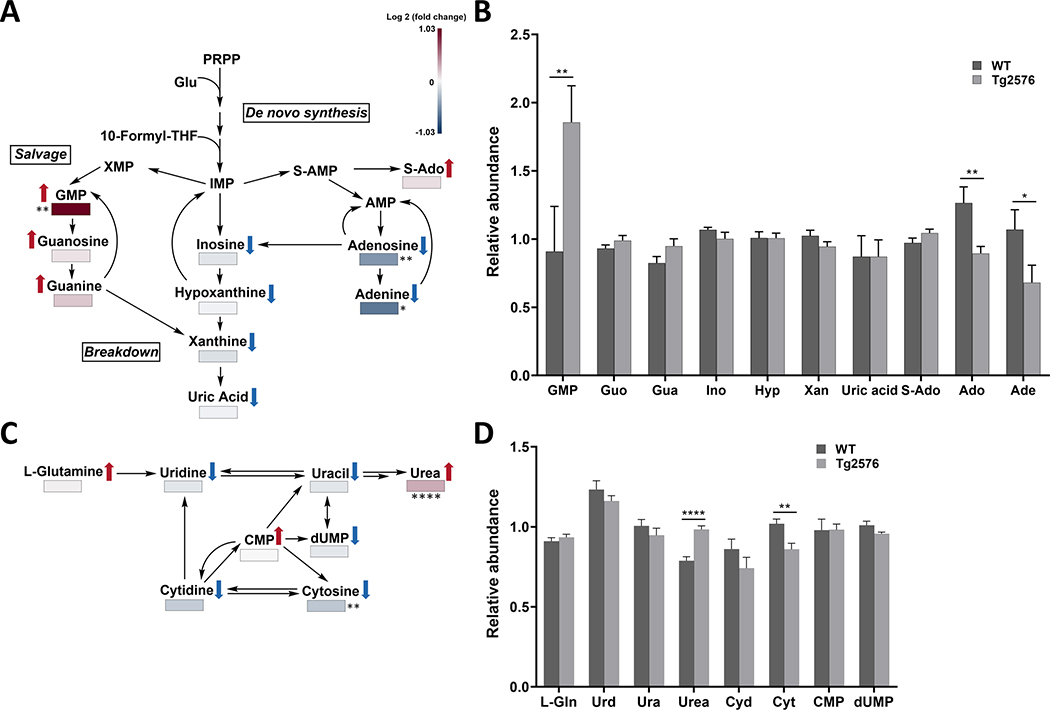
Fig. 5.
The hAPP695SW transgene affects purine and pyrimidine metabolism. A, C) Purine and pyrimidine metabolic pathways with metabolites annotated that showed level changes comparing hippocampal extracts of Tg2576 versus WT mice. The metabolites are color-coded from negative log 2 (fold change) to positive log 2 (fold change) on a gradient from blue to red, respectively ( ,
,  the direction of change comparing Tg2576 versus WT mice). B, D) Bar graphs showing changes in relative abundance values (obtained from the mass spectrum) for metabolites linked to the (B) purine pathway and (D) pyrimidine pathway. Data are expressed as mean values ± standard error of the mean. p-values are calculated using Wilcoxon rank-sum test as a non-parametric test (*p < 0.05, **p < 0.01, ***p < 0.001). Double arrows indicate the involvement of other intermediates in the pathway. GMP, Guanosine monophosphate; Guo, Guanosine; Gua, GUANINE; Ino, INOSINE; Hyp, HYPOXANTHINE; Xan, Xanthine; S-Ado, Succinyladenosine; Ado, ADENOSINE; Ade, ADENINE; L-Gln, L-Glutamine; Urd, Uridine; Ura, Uracil; Cyd, CYTIDINE; Cyt, CYTOSINE; CMP, Cytidine monophosphate; dUPM, Deoxyuridine monophosphate

