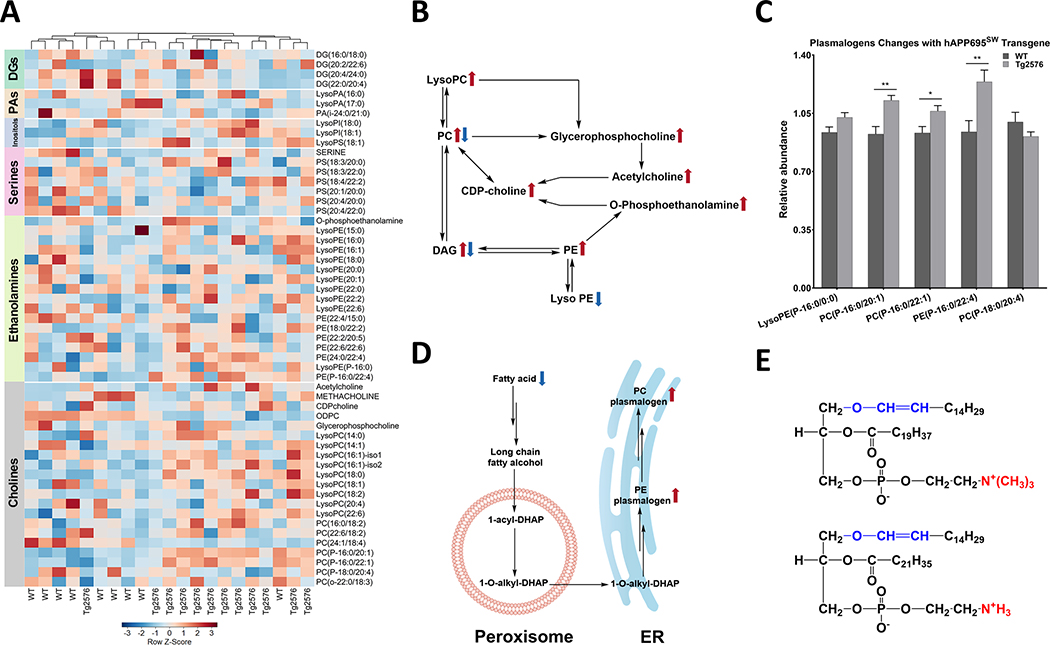
Fig. 7.
Hippocampal glycerophospholipid metabolism is affected in Tg2576 mice. A) Hierarchical clustering analysis of glycosphingolipids is shown as a heatmap which is row Z-score normalized and showing the impact of hAPP695SW transgene. Color bars on the side of the heatmap represent six main classes of metabolites (diacylglycerols (DGs), phosphatidic acids (PAs), inositols, serines, ethanolamines, and cholines). The color-coded gradient is depicted at the bottom. The heatmap is colored based on row Z-scores. Positive Z-score values are shown with red, while negative Z-score values are shown with blue color. B) Glycerophospholipids biosynthesis through the (CDP)-choline pathway. C) Levels of plasmalogens are elevated in the hAPP695SW transgene hippocampi. D) Abbreviated biosynthetic pathway of plasmalogens. E) Structural representation of plasmalogens as ether lipids; representative structures are given: PC(P-16:0/20:1) (upper structure) and PE(P-16:0/22:4). The red color-coded substructure shows the main difference between PC and PE plasmalogens. Metabolites with significant p-value are shown with asterisks which p-values less than 0.001, 0.01, and 0.05 are shown with three (***), two (**), and one asterisks (*), respectively. p-values are calculated using Wilcoxon rank-sum test as a non-parametric test. Double arrows indicate the involvement of other intermediates in the pathway.

