FIG 1.
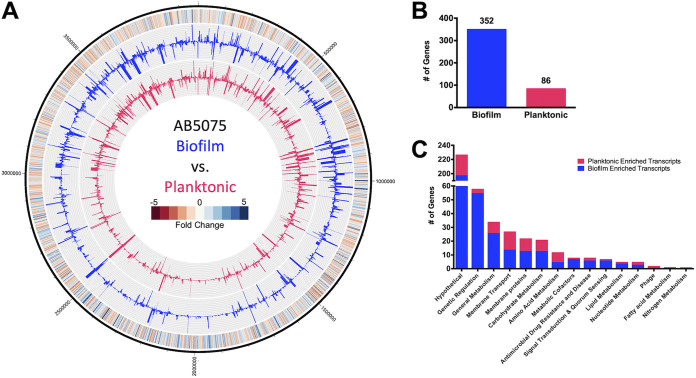
A. baumannii biofilms exhibit differential expression patterns compared to planktonic cell populations. (A) The genomic map depicts changes in planktonic (inner circle, pink) and biofilm (outer circle, blue) transcriptomes, reported as TPM expression values. The outermost circle is a heat map demonstrating the fold change in expression, where red and blue indicate higher expression in the biofilm and planktonic cells, respectively. (B and C) The numbers of genes that were preferentially expressed ≥2-fold in biofilm (blue) or planktonic (pink) cell populations were tallied (B) and further sorted by function based on KEGG ontology (C).

