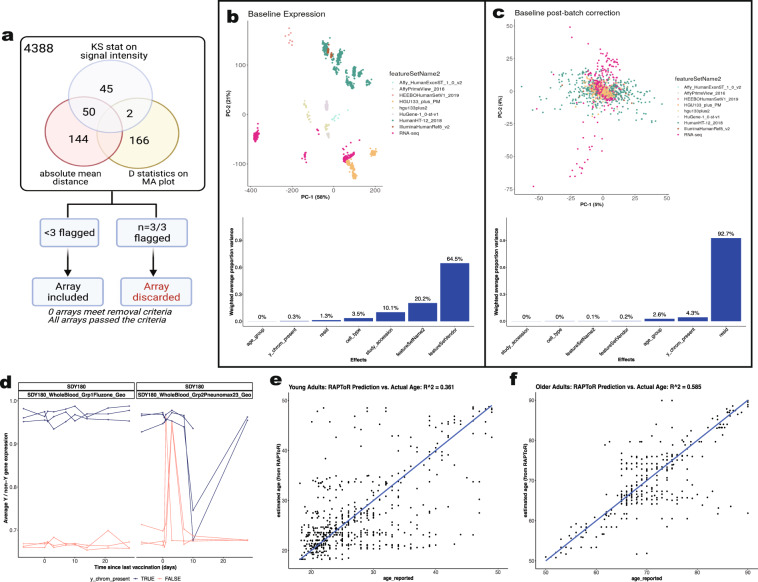
Fig. 3.
Quality control assessments of transcriptomics data. (a) Sample quality assessments of gene expression datasets using Array Quality metrics. Array quality metrics package was employed to assess quality of microarray datasets by checking the following criteria: (a) absolute mean difference between arrays to check the probe and median intensity across all arrays, (b) Kolmogorov-Smirnov statistics to check the signal intensity distribution of arrays, comparing each probe versus distribution of test statistics for all other probes, (c) Hoeffding’s D-statistics for arrays. Arrays were excluded if they fail all three criteria above. (b,c) Principal component analysis (Top) and Principal Variation component Analysis (PVCA) of baseline expression data per study before (B) and after batch correction (C). (d) Biological sex imputation based on expression of Y-chromosome genes. We used 13 Y-chromosome-associated genes to cluster samples into 2 groups assuming biological male or female. (e,f) Age imputation based on transcriptomic profiles for studies without reported ages (SDY1260, SDY1264, SDY1293, SDY1294, SDY1364, SDY1370, SDY1373, SDY984) via the RAPToR R package44. Virtual studies were split into young (age < 50, E) and older (age > = 50, F) for two separate predictive models.

