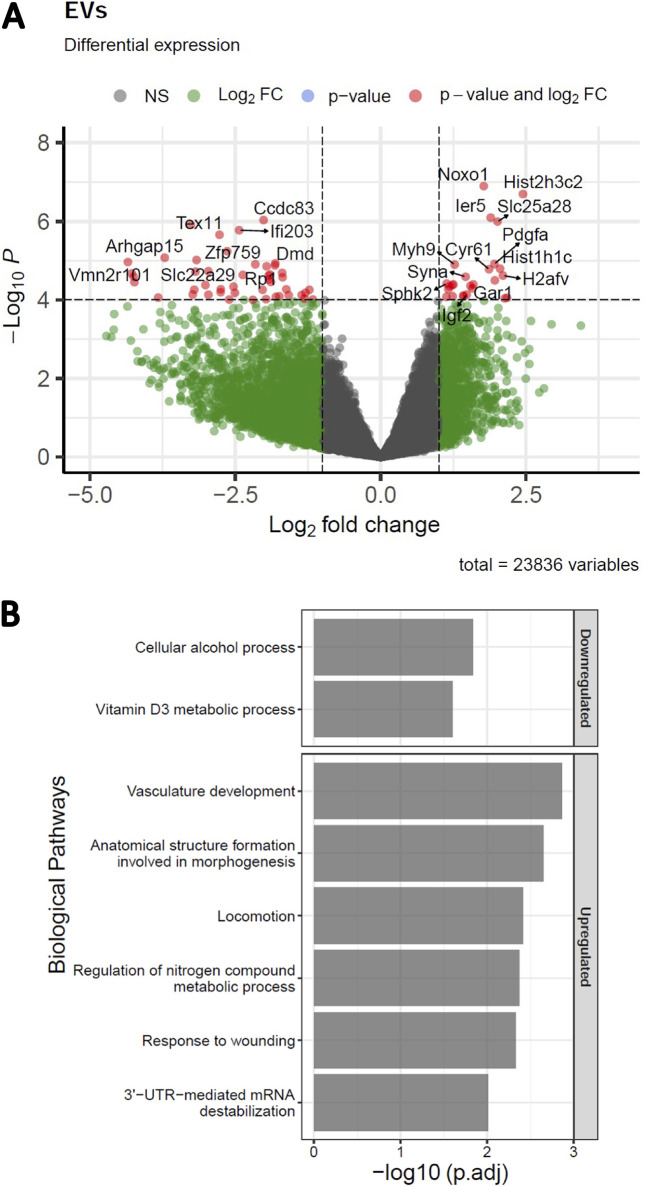
FIG 5.
L. monocytogenes-infected TSCs produce S-tEVs with altered RNA profiles. (A) Volcano plot of differentially expressed genes in S-tEVs from L. monocytogenes-infected and uninfected TSCs. Red dots represent statistical significance (P < 10−5) and log2 fold change (FC) greater or less than 1. Total variables represent the number of genes that were used to generate a volcano plot. (B) Gene ontology analysis of differentially expressed genes (p-adj of <0.05) was used to investigate the biological process pathways that were downregulated and upregulated in L. monocytogenes-infected cells using gProfileR.

