Fig. 1.
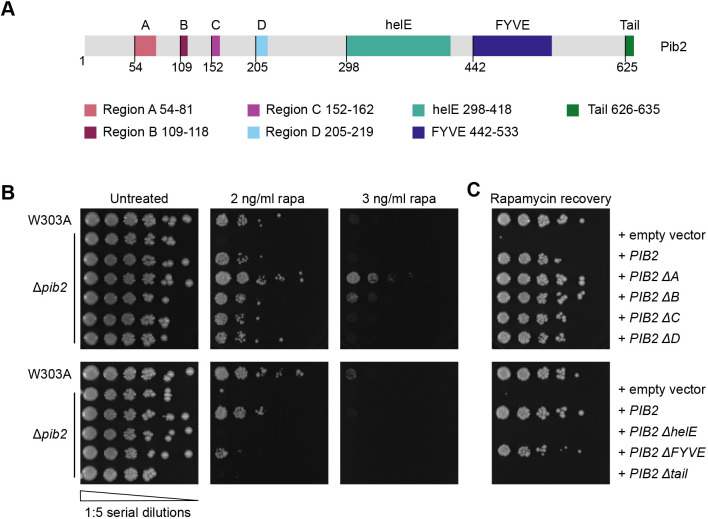
TORC1 reactivation is differentially regulated by conserved Pib2 regions. (A) The primary structure of Pib2, highlighting its conserved regions. The starting residue number of each region is shown below the schematic. Deletion constructs were generated by replacing the indicated regions with a short AGAGA linker. (B) Rapamycin exposure assay assessing growth of W303A and Δpib2 cells expressing the indicated constructs on YPD or YPD supplemented with the indicated low concentration of rapamycin (rapa). The left-most spots correspond to 2 µl of a OD600=0.5 culture, followed by 2 µl of sequential 1:5 dilutions. (C) Rapamycin recovery assay assessing growth of W303A and Δpib2 expressing the indicated constructs on YPD following rapamycin exposure. Exponentially growing cells were treated with 200 ng/ml rapamycin in YPD at 30°C for 4 h. After washing, cells were plated on YPD and incubated at 30°C for 3 days. Cells were plated as in B. Images are representative of three experiments.

