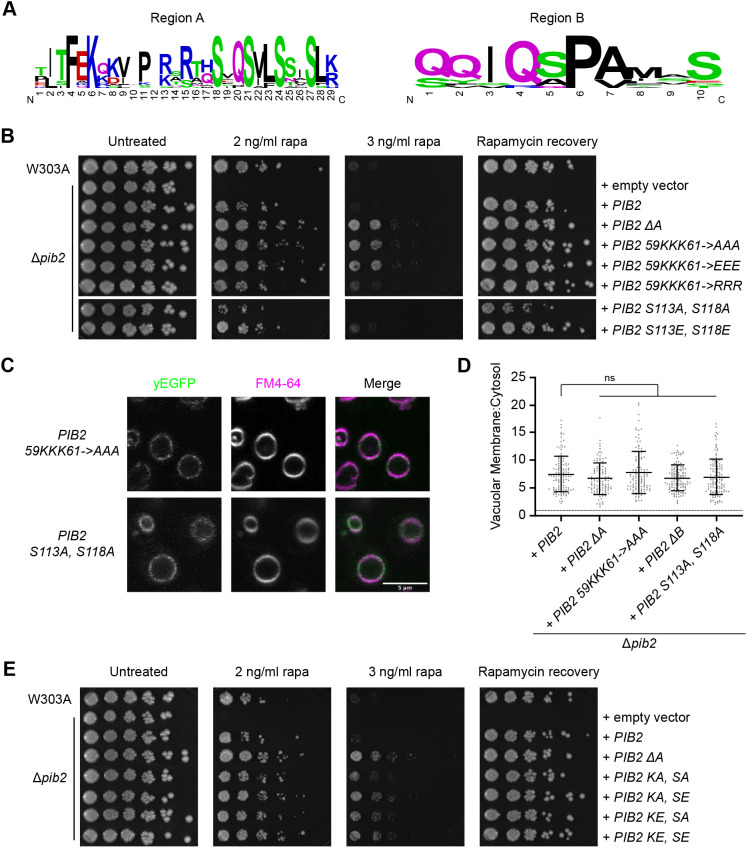
Fig. 3.
Key residues in Pib2 regions A and B are involved in the TORC1 inhibitory mechanism. (A) Sequence logos illustrating the residues conserved in Pib2 regions A and B (15 ascomycete fungi sequences used for alignment). Residue label size is proportional to conservation. (B) Rapamycin exposure and recovery assays of Δpib2 cells expressing the indicated constructs. These were performed as in Fig. 1. (C) Vacuolar localization of indicated yEGFP–Pib2 mutant constructs. Vacuoles were stained with FM4-64. (D) Quantification (mean±s.d.) of the data presented in C. Data for Pib2, Pib2 ΔA, and Pib2 ΔB are the same as in Fig. 2B. Following a ROUT outlier analysis (Q=0.1%), a one-way ANOVA was conducted to determine differences in vacuolar localization (F=3.040, P=0.0169). There were no significant differences from Pib2 localization as determined by Tukey multiple comparisons test. A total of 117–126 cells was quantified for each construct. (E) Rapamycin exposure and recovery assays of Δpib2 cells expressing the indicated constructs. These were performed as in Fig. 1. Images in B,E are representative of three experiments.

