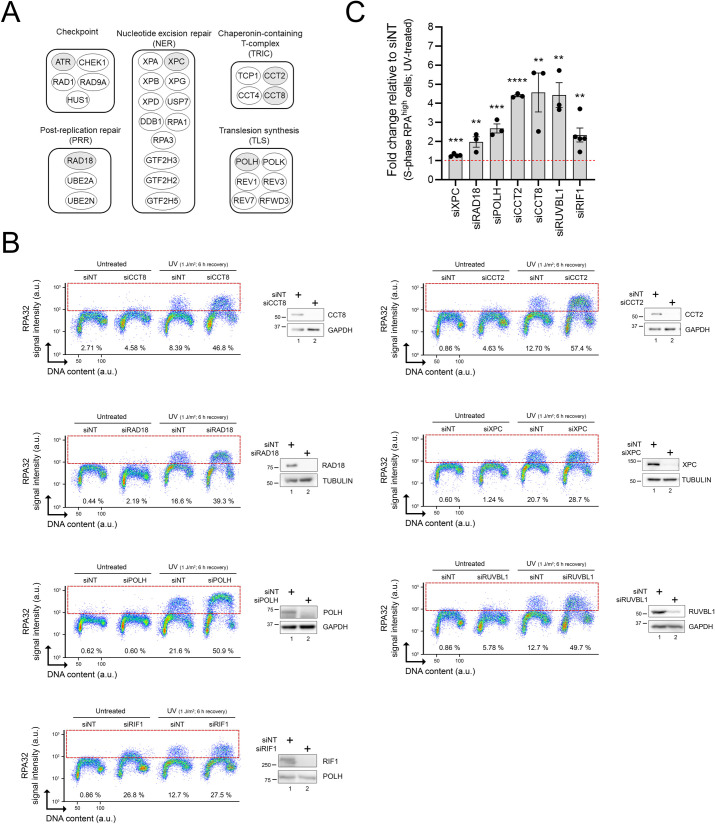
Fig 2. Validation of selected genes identified in the CRISPR-Cas9 screen.
(A) Main functional groups derived from genes recovered in the screen. Genes selected for further validation are shaded in grey. (B) Representative immunofluorescence flow cytometry assays and immunoblots after siRNA-mediated depletion of selected genes. Cells transfected with nontargeting (siNT) or gene-specific siRNAs were mock- or UV-treated (1 J/m2). % RPAhigh cells (dashed box) were assessed 6 h after irradiation. (C) Quantification of (B). Values represent the mean ± SEM of at least 3 independent experiments. Statistics used: unpaired t test corrected for multiple comparisons using the Holm–Šídák method. *: p ≤ 0.05, **: p ≤ 0.01, ***: p ≤ 0.001, ****: p ≤ 0.0001. The data underlying the graph shown in the figure can be found in S1 Data. a.u., arbitrary units; RPA, Replication Protein A.

