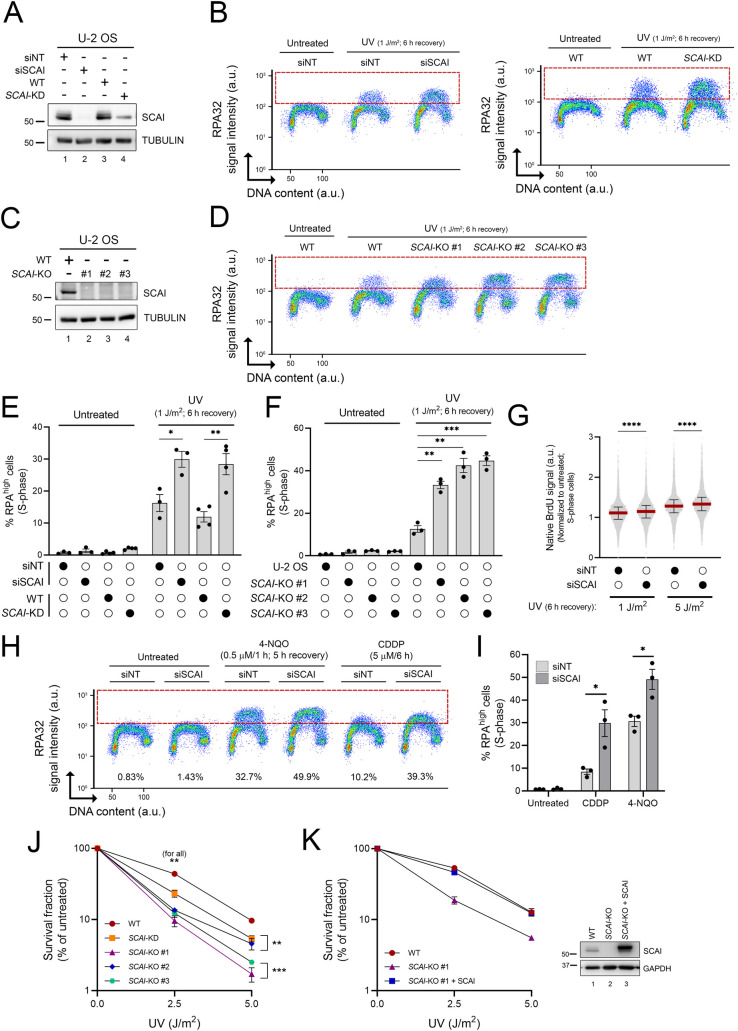
Fig 3. SCAI influences the replication stress response post-UV.
(A, C) Immunoblot of whole-cell extracts from control U-2 OS, SCAI-depleted cells (A) and SCAI KO cells (C). (B, D) Immunofluorescence flow cytometry measurements of DNA-associated RPA32 in control, SCAI-depleted cells (B, left plot: siSCAI, right plot: SCAI-KD), or SCAI-KO (D) cells 6 h after 1 J/m2 UV irradiation. RPAhigh cells are delineated by a dashed box. (E, F) Quantification from (B) and (D), respectively. Values are the mean ± SEM from at least 3 independent experiments. (G) Depletion of SCAI increases ssDNA generation post-UV. Control and SCAI-depleted cells were exposed to BrdU for 48 h, and then irradiated with UV as indicated. Native BrdU signal was assessed by immunofluorescence flow cytometry at 6 h post-UV. Median is presented (red line), and error bars indicate the interquartile range. Data combined from 2 independent experiments with similar results. (H) Immunofluorescence flow cytometry measurements of DNA-associated RPA32 in control and SCAI-depleted cells (as in (B)). U-2 OS transfected with siNT or siSCAI were treated with 0.5 μM 4-NQO for 1 h and allowed to recover for 5 h or continuously exposed for 6 h to 5 μM cisplatin (CPPD). (I) Quantification from (H). Values are the mean ± SEM from 3 independent experiments. (J) SCAI-KD/KO cells are sensitive to UV as measured by clonogenic survival. Values are the mean ± SEM from 3 independent experiments. (K) Rescue of UV sensitivity of SCAI-KO cells by transient overexpression of SCAI as determined by clonogenic survival. Values are the mean ± SEM from 2 independent experiments. Right: immunoblot of whole-cell extracts from control U-2 OS (WT), SCAI KO cells, and SCAI-KO that transiently overexpress SCAI. Statistics used: two-tailed unpaired Student t test (E, I), unpaired t test corrected for multiple comparisons using the Holm–Šídák method (J, F), and Mann–Whitney (G). *: p ≤ 0.05, **: p ≤ 0.01, ***: p ≤ 0.001, ****: p ≤ 0.0001. The data underlying the graphs shown in the figure can be found in S1 Data. 4-NQO, 4-nitroquinoline 1-oxide; a.u., arbitrary units; CDDP, cisplatin KD, knockdown; KO, knockout; RPA, Replication Protein A; ssDNA, single-stranded DNA siNT, nontargeting siRNA; siSCAI, SCAI-targeting siRNA; WT, wild type.

