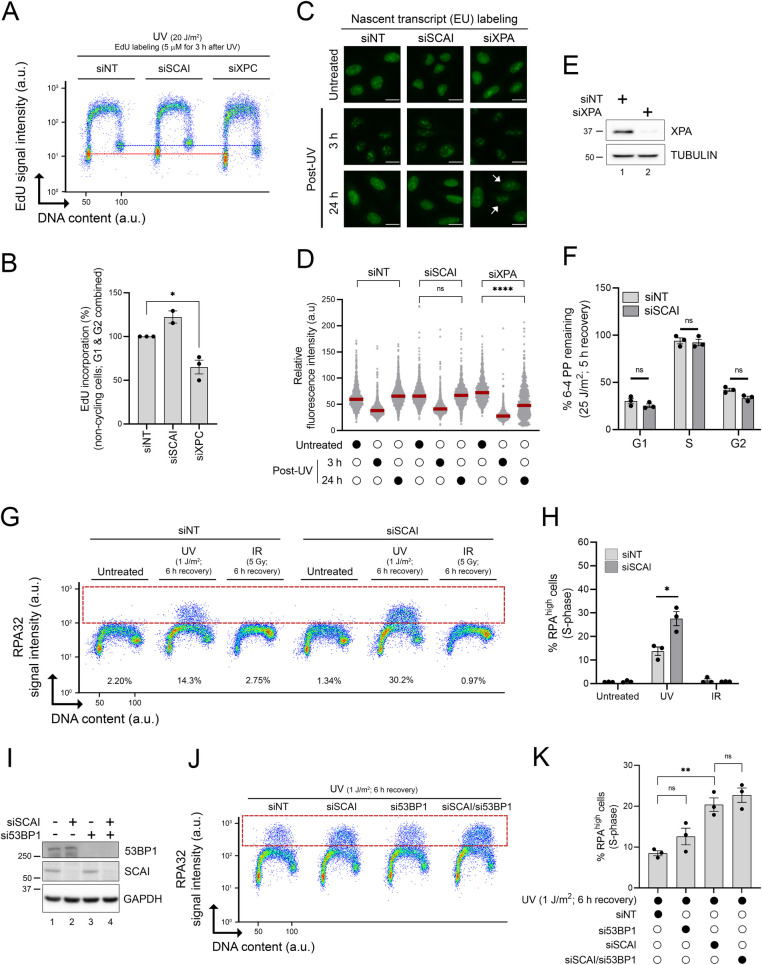
Fig 4. The functions of SCAI in the UV-induced replication stress response are unrelated to NER or 53BP1-dependent DSB repair.
(A) Immunofluorescence flow cytometry was used to measure repair synthesis-associated EdU incorporation in G1/G2 cells (y-axis) and total DNA content (x-axis; DAPI signal). Cells transfected with siNT, SCAI-, or XPC-targeting siRNAs were irradiated with 20 J/m2 UV and allowed to recover for 3 h in medium containing 5 μM EdU. The red and blue dashed lines are positioned, respectively, in the middle of the EdU signal of the G1 and G2 cell populations of the siNT-treated cells to facilitate comparison. (B) Quantification from (A). Values are the mean ± SEM from at least 2 independent experiments and are relative to siNT-treated cells. (C) Representative images of 5-EU incorporation from cells transfected with the indicated siRNA. Cells were either mock- or UV-treated (6 J/m2) and samples collected 3 and 24 h after irradiation. Scale bar = 20 μM. White arrows indicate cells with reduced incorporation of 5-EU. (D) Quantification from (C). The red lines represent the median. The assay was repeated twice independently with similar result. (E) Validation of siRNA-mediated KD of XPA using immunoblot. (F) Quantification of UV-induced 6-4PP removal as a function of cell cycle using a flow cytometry–based assay from cells transfected with siNT or siSCAI. Values are the mean ± SEM from 3 independent experiments. (G) Immunofluorescence flow cytometry was used to measure DNA-bound RPA32 (y-axis) and DNA content (x-axis; DAPI signal). Cells were irradiated with either 1 J/m2 UV or 5 Gy IR and allowed to recover for 6 h prior to sample collection. The dashed red box delineates DNA-bound RPAhigh cells. Representative flow cytometry plots are shown. (H) Quantification from (G). Values represent the mean ± SEM from 3 experiments. (I) Immunoblot analysis from cells transfected with the indicated siRNAs. (J) siNT-, siSCAI-, si53BP1-, and siSCAI/si53BP1-transfected cells were irradiated with 1 J/m2 UV and allowed to recover for 6 h before immunofluorescence flow cytometry analysis. The dashed red box delineates DNA-bound RPAhigh cells. Representative flow cytometry plots are shown. (J) Quantification from (I). Values represent the mean ± SEM from 3 independent experiments. Statistics used: two-tailed unpaired Student t test (B, H), two-tailed Mann–Whitney test (D), unpaired t test corrected for multiple comparisons using the Holm–Šídák method (F, I). ns: nonsignificant, *: p ≤ 0.05, **: p ≤ 0.01, ****: p ≤ 0.0001. The data underlying the graphs shown in the figure can be found in S1 Data. a.u., arbitrary units; DAPI, 4′,6-diamidino-2-phenylindole DSB, double-strand break; EdU, 5-ethynyl-2′-deoxyuridine; EU,5-ethynyl-uridine IR, ionizing radiation; KD, knockdown; NER, nucleotide excision repair; RPA, Replication Protein A; SEM, standard error of the mean 6-4PP, 6–4 pyrimidine-pyrimidone photoproduct.

