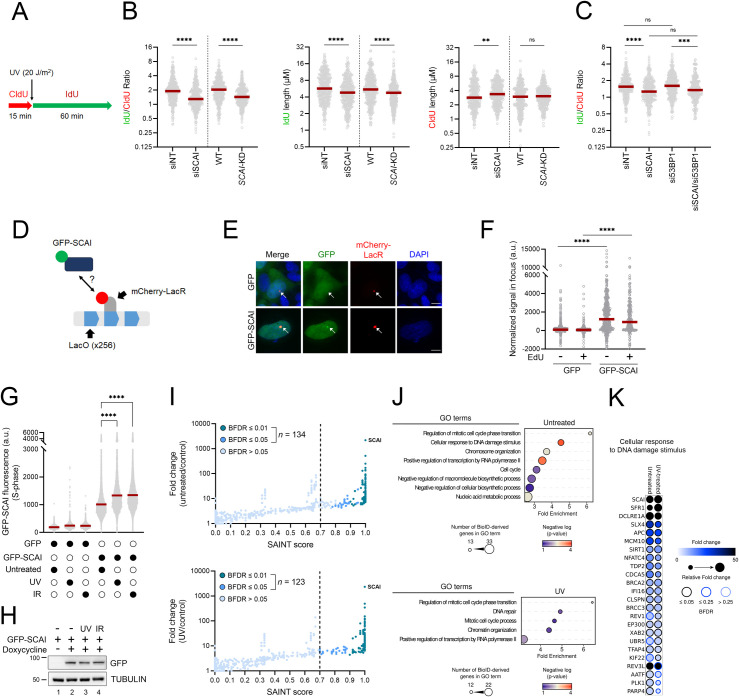
Fig 5. SCAI influences RF progression in cells exposed to UV.
(A) Schematic of the DNA fiber assay used to assess RF progression post-UV. Cells were incubated with CldU (red) for 15 min, irradiated with UV (20 J/m2), and then incubated with IdU (green) for 60 min. (B) Left panel: dot plot and median (red line) of IdU/CldU ratio from control (siNT or WT) or SCAI-depleted (siSCAI or SCAI-KD) cells. Middle panel: dot plot and median of IdU tract lengths. Right panel: dot plot and median of CIdU tract lengths (data combined from n = 3 with similar result). (C) 53BP1 does not influence RF progression post-UV in cells lacking SCAI. Similar experiment as in (B) (left panel; data combined from n = 2 with similar result). (D) SCAI localizes to stalled RFs. Schematic of the assay used to evaluate recruitment of SCAI to stalled RF caused by binding of mCherry-LacR to a LacO array. (E) Representative microscopy images for the assay described in (D). Scale bar = 10 μM. (F) Quantification of GFP or GFP-SCAI normalized signal intensity in the mCherry-LacR foci in non-S phase cells (EdU−) or S phase cells (EdU+). Each point represents a single cell. Lines represent the median. Data combined from 3 similar biological replicates. (G) GFP-SCAI associates with DNA post-UV. Signal intensity from S phase cells was determined by flow cytometry +/− irradiation with 2 J/m2 UV or 5 Gy IR. Cells were allowed to recover for 6 h (UV) or 5 h (IR). Red line represents the mean. Representative results from 3 independent experiments. (H) Immunoblot analysis of the expression level of GFP-SCAI under the experimental conditions described in (G) ± induction by doxycycline. (I) Interrogation of proximity interactome was performed through biotin labeling using TurboID-SCAI under untreated and UV-treated (2 J/m2) conditions. Fold-change is relative to the CRAPome background controls (see Materials and methods). Proteins with a SAINT score ≥0.7 and a BFDR ≤0.05 are considered significant. (J) GO term enrichment analysis of proteins found in the untreated and UV-treated conditions. (K) Proteins associated with the GO term “Cellular response to DNA damage stimulus” are shown as a dot plot in which node color represents the fold increase, node size represents the relative fold change between the experimental conditions, and node edges represent the SAINTexpress BFDR. Raw data are in S2 Table. Statistics used: Mann–Whitney test (B), Kruskal–Wallis with Dunn’s multiple comparisons test (C), two-tailed unpaired Student t test (F), one-way ANOVA corrected for multiple comparisons using Tukey’s test (G). ns: nonsignificant, *: p ≤ 0.05, **: p ≤ 0.01, ***: p ≤ 0.001, ****: p ≤ 0.0001. The data underlying the graphs shown in the figure can be found in S1 Data. a.u., arbitrary units; BFDR, Bayesian false discovery rate; CldU, 5-chloro-2′-deoxyuridine GO, Gene Ontology; IdU, 5-iodo-2′-deoxyuridine IR, ionizing radiation; RF, replication fork; SAINTexpress, Significance Analysis of INTeractome; WT, wild type.

