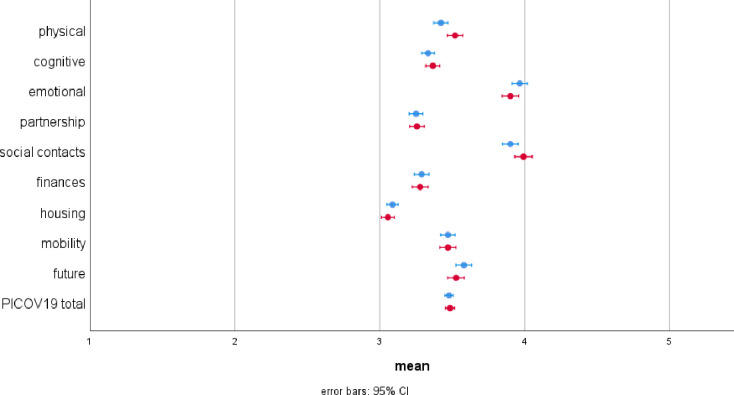
Fig 1. Means and 95% confidence intervals of the PICOV19 items and the total score at baseline (blue) and six months follow-up (red).
The scale is reversely coded indicating: 1 = very positive effects; 2 = positive effects; 3 = neither positive nor negative effects, 4 = negative effects, 5 = very negative effects.

