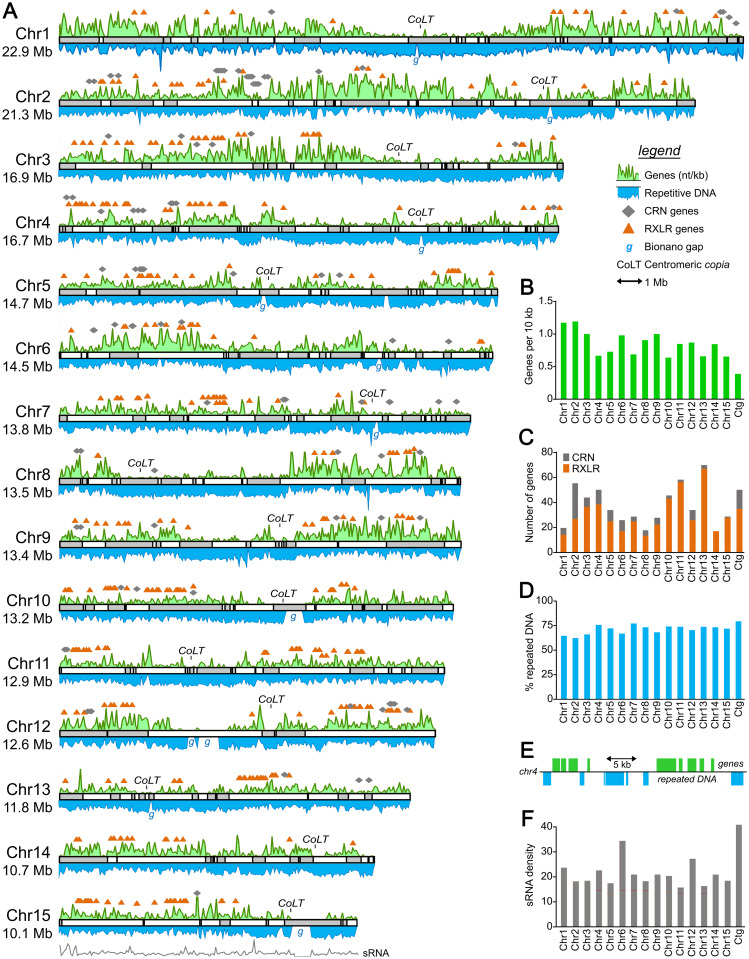
Fig 2. Structure of P. infestans chromosomes.
A, Maps of the chromosomes, with contigs from the Stitch7 assembly shown as alternating white and grey blocks. Each chromosome (Chr prefix) is marked along with its predicted size in Mb. The green and blue curves above and below each chromosome map represent the relative density of genes and repeats, respectively, as nt per kb. Positions of effector genes are shown above each chromosome, with RXLRs and CRNs represented by orange triangles and grey diamonds, respectively. Clusters of the copia-like element associated with centromeres are marked as CoLT, and gaps predicted by the Bionano optical map are marked as g. The grey line under Chr15 represents the relative density of small RNAs, as nt per kb. B, gene densities per chromosome (Chr1 to Chr15) or on contigs not placed on chromosomes (ctg). C, number of CRN and RXLR genes per chromosome or unplaced contigs. D. Percent repeated DNA per chromosome or on unplaced contigs. E, typical arrangement of genes and repeated DNA, showing a representative portion of Chr4. F, relative density of small RNAs on chromosomes or contigs.

