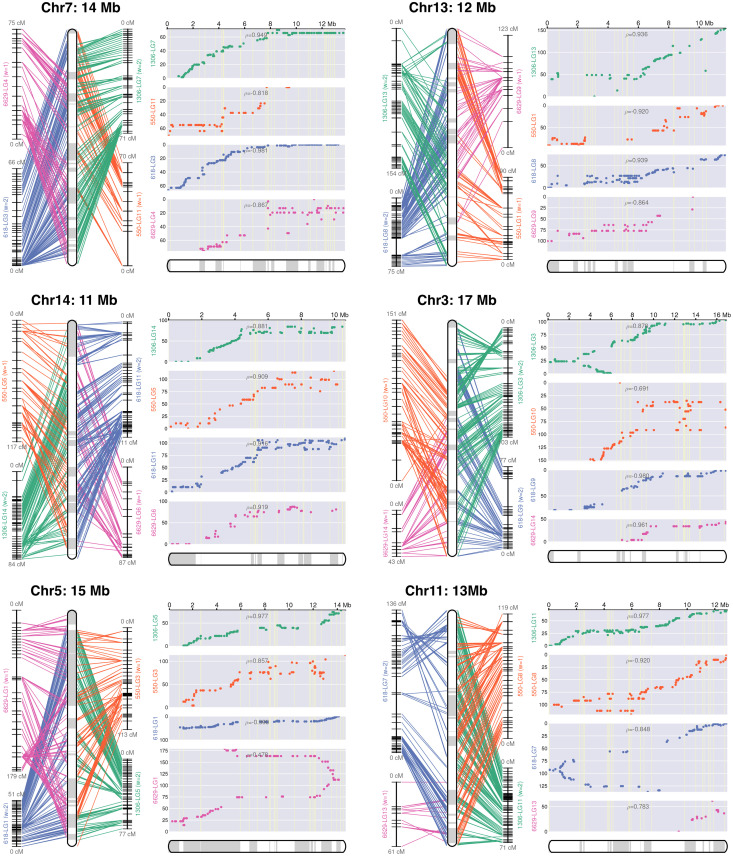
Fig 3. Representative chromosome assemblies.
Illustrated are genetic and physical maps for six of the chromosomes; all 15 are presented in S1 Fig. The left panel for each chromosome shows line graphs representing linkage groups (LG) developed for the four parents, with horizontal marks representing loci used for genetic linkage analysis. The rounded rectangles at the center of the panel represent the consensus map for the chromosome, with contigs joined by linkage analysis represented by alternating white and grey sections. The right panels (grey background) show plots of genetic versus physical distance for each chromosome in each parent. The x-axis represents the physical location along the chromosome and the y-axis represents the distance in centimorgans.

