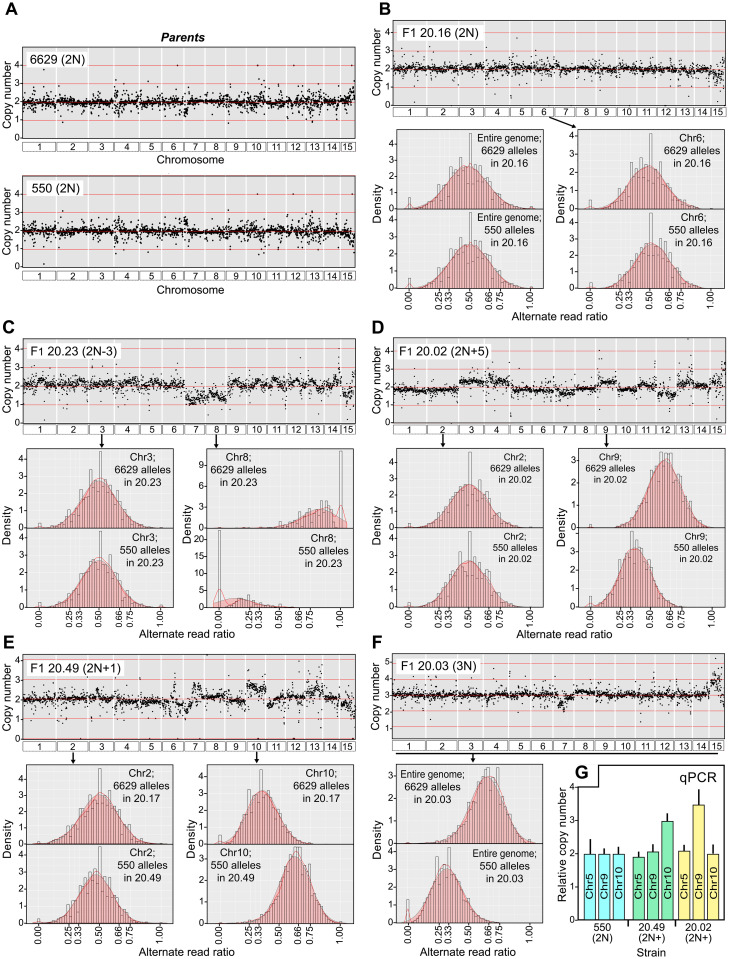
Fig 5. Chromosomal content of representative strains.
A, Normalized Illumina read depth across all chromosomes in parents 6629 and 550. B, A representative diploid F1 (20.16) from the 6629×550 cross. Plotted in the scatterplot at the top is the normalized read depth. Presented below are bar graphs showing the alternate read ratios (i.e. inferred allele ratios) of SNPs originating from 6629 and 550 across the whole genome (left) or on a representative chromosome, Chr6 (right). C, Data for an aneuploid F1, 20.23, which bears Chr7 and 8 deficiencies. Read ratio graphs are shown for a typical 2N chromosome (Chr3) and one with a deficiency (Chr8). D, Similar data for F1 20.02, which appears to be mostly diploid with excesses (Chr3, Chr4, Chr7, Chr9) or deficiencies (Chr12). Read ratio graphs are shown for a representative 2N chromosome (Chr2) and one with three copies (Chr9). E, Similar data for F1 20.49, which appears to be diploid but with trisomy for chromosome 10. F, Similar data for F1 20.03, which appears to be a balanced triploid based on a 2:1 alternate read ratio across the genome. G, Validation of ploidy differences by qPCR. Primers targeting loci on Chr5, Chr9, and Chr10 were used to determine their copy numbers relative to strain 550 in progeny 20.49 and 20.02, which as indicated in panels E and D contain extra copies of Chr9 and 10, respectively.

