
Figure 1. Optogenetically-induced fUSI responses can be detected through chronic cranial windows.
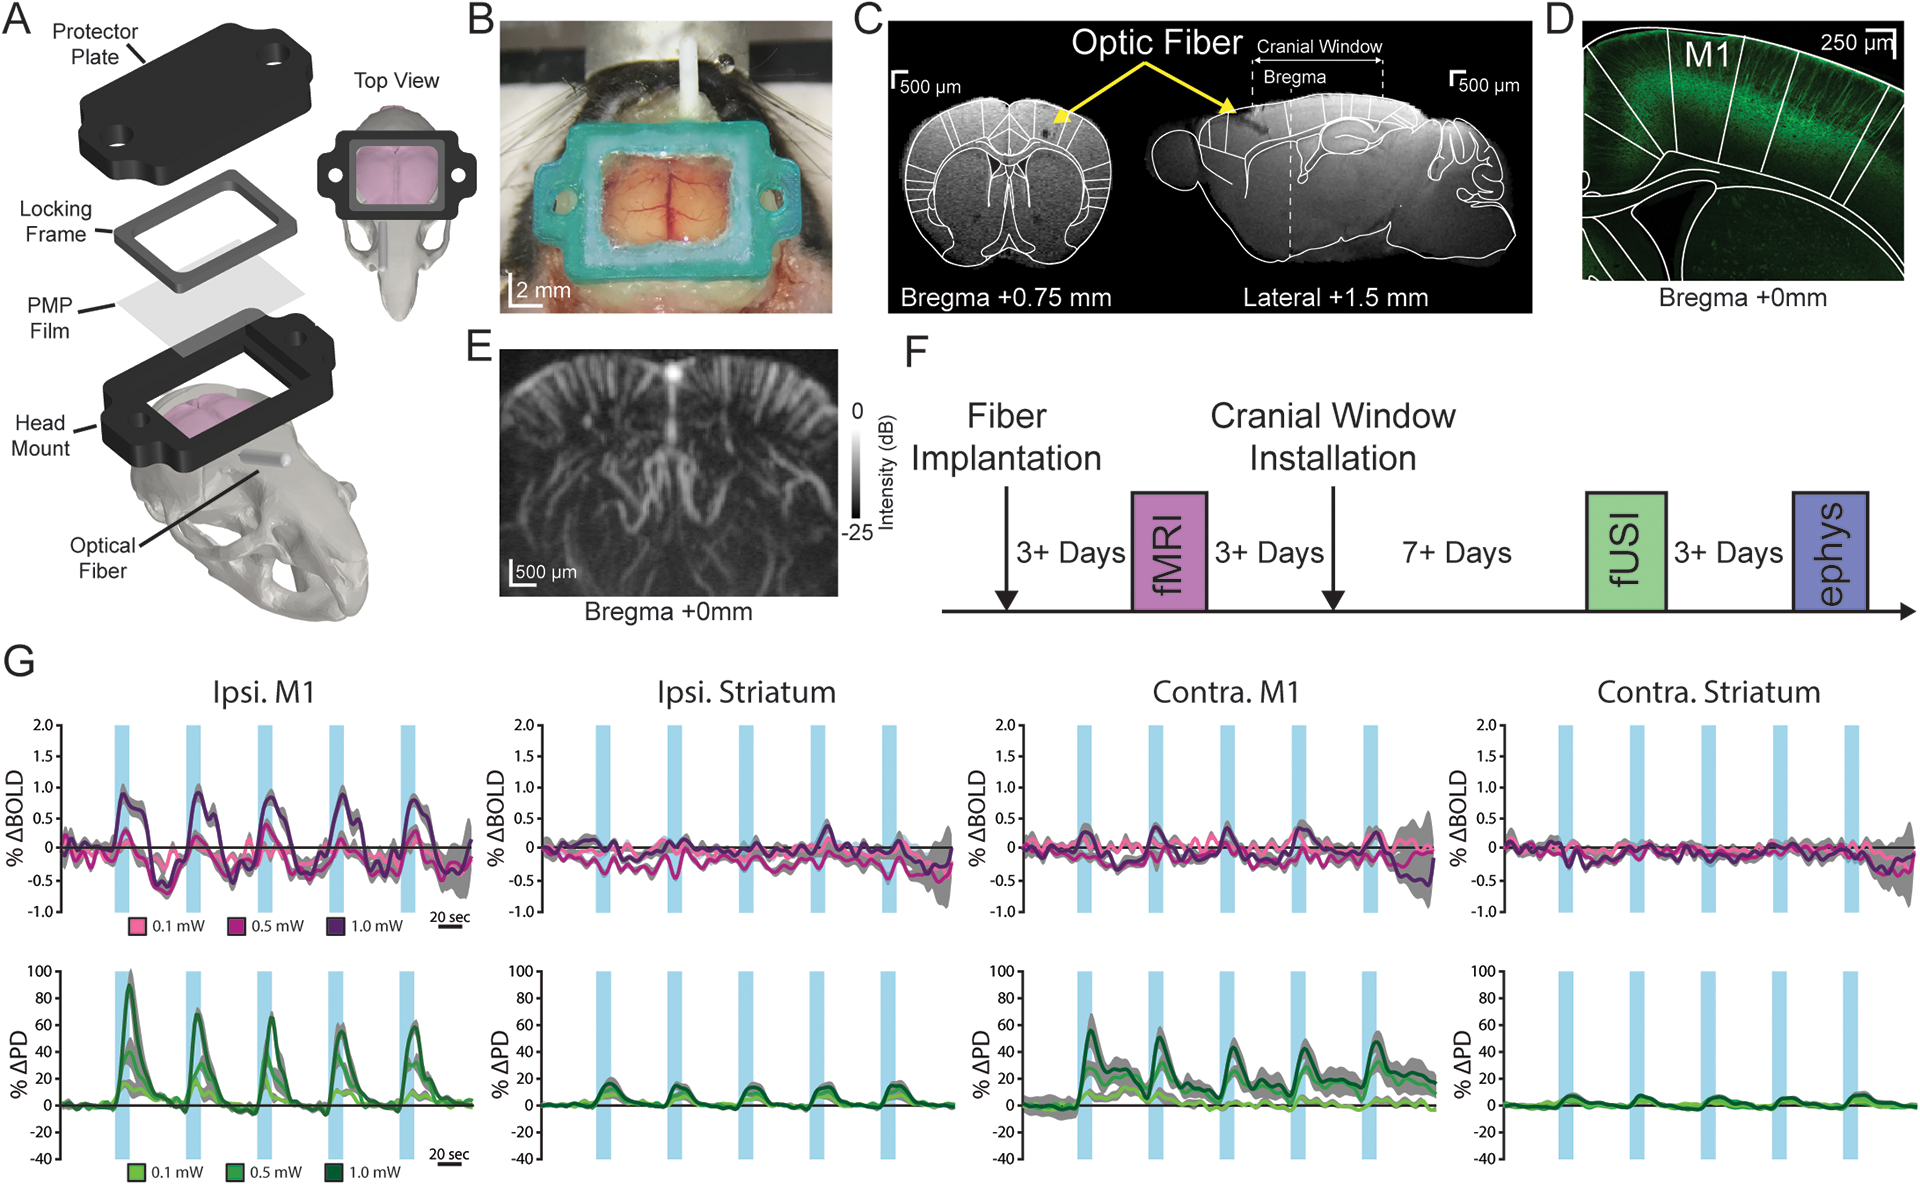
(A) Computer-aided design schematic of the cranial window and optic fiber installation. (B) Image of a chronic cranial window installed on a mouse. (C) Coronal (left) and sagittal (right) view of a structural magnetic resonance image (MRI) with a cranial window and optic fiber implanted in the right primary motor cortex (M1). (D) Representative histological image of endogenous ChR2-YFP expression in layer V of M1. (E) Power Doppler image depicting the coronal field of view at bregma +0 mm. (F) Experimental timeline for fUSI, fMRI, and electrophysiological recordings in response to optogenetic stimulations. (G) Average fMRI (pre-cranial window; top, purple) and fUSI (bottom, green) time series from the bilateral primary motor cortex (M1) and striatum during right M1 stimulation at 10 Hz. Data are presented as mean (color) ± SEM (shaded region). Increasing darkness of the lines represents increasing stimulation intensities. The blue vertical bars indicate stimulation periods.