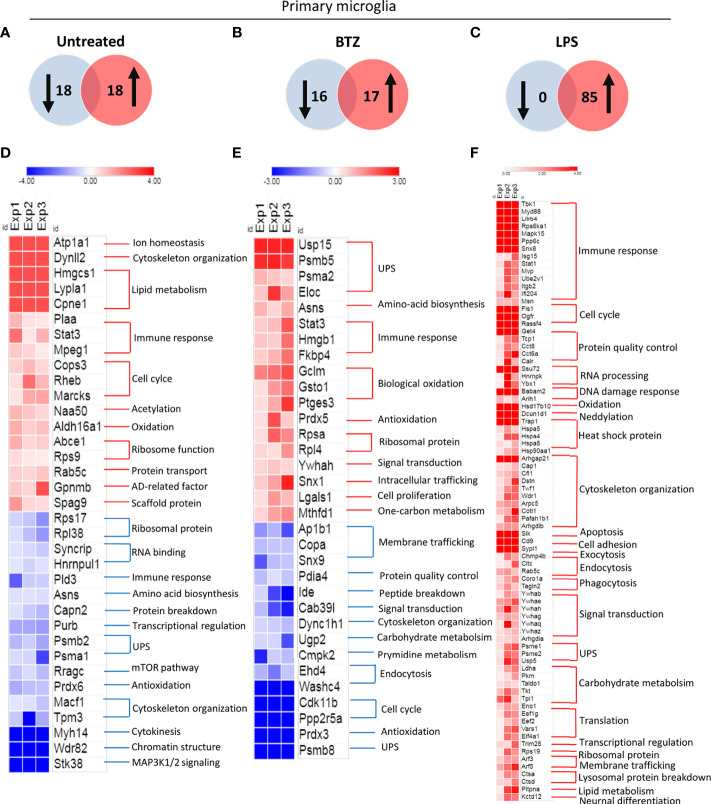
Figure 3.
Immunoproteasome dysfunction alters the profile of ubiquitylated proteins in primary microglia identified by proteomics. Identified ubiquitylated proteins were compared in WT and β5i/LMP7 KO microglia by the fold changes of protein abundances. (A–C) Venn diagrams showing identified ubiquitylated protein numbers decreased (left, blue) and increased (right, red) in untreated (A), 8h 50nM BTZ treated (B), and 8h 1µg/mL LPS stimulated (C) β5i/LMP7 KO primary microglia in comparison to WT untreated, 8h 50nM BTZ treated, and 8h 1µg/mL LPS stimulated primary microglia, respectively. (D–F) Heatmaps showing proteins increased (red) and decreased (blue) in untreated (D), 8h 50nM BTZ treated (E), and 8h 1µg/mL LPS stimulated (F) β5i/LMP7 KO primary microglia in comparison to WT untreated, 8h 50nM BTZ treated, and 8h 1µg/mL LPS stimulated primary microglia, respectively. Heatmap data are given by log2 values of fold changes in protein abundances ((n=3) fold change cut off 1,3).

