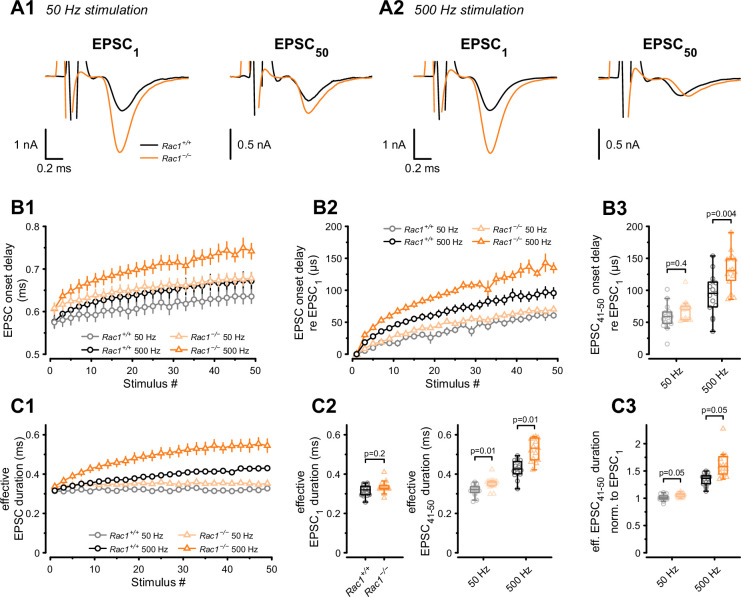
Figure 4. Presynaptic loss of Rac1 decreases SV synchronicity and prolongs EPSC onset at high-frequency stimulation.
(A) Experiments were performed at low (50 Hz, A1) and high (500 Hz, A2) stimulation frequencies. Representative recordings of first (EPSC1) and last (EPSC50) EPSC in the stimulus train. Traces are aligned at the EPSC onset of EPSC1. Stimulus artifacts are partially blanked for better visibility. Note the shift in the onset of EPSC50 in Rac1−/− compared to Rac1+/+ at 500 Hz but not 50 Hz. (B1) Absolute EPSC onset delay for 50 Hz (gray and light orange) and 500 Hz (black and orange) stimulation. (B2) EPSC onset delay relative to EPSC1 for 50 Hz (gray and light orange) and 500 Hz (black and orange). At 50 Hz, the EPSC onset delay was similar between Rac1+/+ and Rac1−/−. At 500 Hz, the EPSC onset delay was substantially larger at Rac1−/−. For better visualization, only every second data point is shown. (B3) EPSC onset delay of the last ten EPSCs relative to EPSC1 for 50 Hz and 500 Hz stimulation. EPSC delay of the last ten EPSCs in the stimulus train (EPSC41-50) was not different between Rac1+/+ and Rac1−/− at 50 Hz but increased for Rac1−/− at 500 Hz stimulation frequency. (C1) Analysis of ‘effective EPSC duration’ to estimate SV release synchronicity during 50 Hz and 500 Hz stimulation. Synchronicity was estimated from ‘effective EPSC duration’ by dividing the EPSC charge by the EPSC amplitude. Note the increase in effective EPSC duration for Rac1−/− at 500 Hz stimulation. For better visualization, only every second data point is shown (C2) EPSC duration was not different for EPSC1 but slightly longer for late EPSCs in Rac1−/− at 50 Hz and substantially longer at 500 Hz stimulation frequency. (C3) Effective EPSC duration of EPSC41-50 normalized to EPSC1. Note the progressive increase in effective EPSC duration in Rac1−/− with increasing stimulation frequency. All data shown in the figure and the detailed results of statistical tests are part of the supplementary file.

