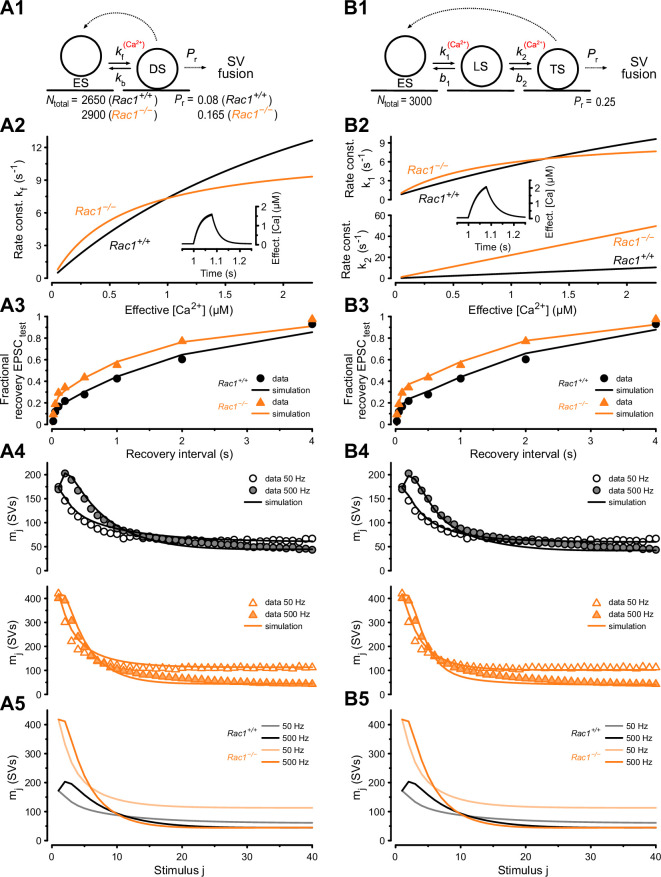
Figure 6. Numerical simulations of 50 and 500 Hz STP and EPSC recovery after conditioning 500 Hz trains are consistent with Rac1-loss induced changes in SV priming.
Experimental observations were equally well reproduced by either of two kinetic schemes of SV priming and fusion: a single-pool model (A) or a recently proposed (Lin et al., 2022) sequential two-step SV priming scheme (B). (A1) Diagram of vesicle states for the single-pool model. SVs reversibly dock at empty release sites (ES). SVs in the docked and primed state (DS) undergo fusion with the probability Pr upon AP arrival. Vacated sites become immediately available for SV docking and priming. Transitions represented by dashed lines occur instantaneously, while those represented by solid lines occur with rate constants as indicated. Forward transition rate constant is Ca2+-dependent. For the single-pool model, Pr and total number of sites (Ntotal) were free parameters for both genotypes. The model predicts an increased Pr from 0.08 (Rac1+/+) to 0.165 (Rac1−/−) and an increase in the number of docked SVs (RRP) from 2150 SVs (Rac1+/+) to 2532 SVs (Rac1−/−). (A2) Dependence of kf on cytosolic [Ca2+] (effective [Ca2+]) for Rac1+/+ (black) and Rac1−/− (orange) synapses. The inset illustrates the time course of the effective [Ca2+] during a 500 Hz train consisting of 40 stimuli. (A3) Predictions of the single-pool model (lines) for the time course of the fractional recovery of EPSCtest after 500 Hz conditioning trains superimposed onto experimental data for Rac1+/+ (black circles) and Rac1−/− (orange triangles) synapses (data from Figure 5A3). (A4) Predictions of the single-pool model (lines) for the time course of STP during 50 Hz and 500 Hz trains superimposed onto experimental data (circles) for Rac1+/+ (black, top panel) and Rac1−/− (orange, bottom panel) synapses. (A5) Model predictions for the time course of STP during 50 Hz and 500 Hz trains for Rac1+/+ (gray and black) and Rac1−/− (light and dark orange) synapses shown superimposed to facilitate comparison. (B1) Diagram of vesicle states for the sequential two-step priming scheme. SVs reversibly dock at empty release sites (ES) and become fusion-competent by undergoing a sequence of two priming steps. After initial docking, SVs in the loosely docked state (LS) reversibly transition to the tightly docked state (TS) from which they undergo fusion upon AP arrival with the probability Pr. Vacated sites become immediately available for SV docking and priming. Transitions represented by dashed lines occur instantaneously, while those represented by solid lines occur with rate constants as indicated. Forward transition rate constants are Ca2+-dependent. For the sequential two-step priming scheme, Pr and total number of sites (Ntotal) were constrained to the same values for Rac1+/+ and Rac1−/− synapses and only parameters determining the kinetics of the two priming steps were allowed to differ between genotypes. (B2) Dependence of k1 (top panel) and k2 (bottom panel) on cytosolic [Ca2+] for Rac1+/+ (black) and Rac1−/− (orange) synapses. The inset illustrates the time course of the effective [Ca2+] during a 500 Hz train consisting of 40 stimuli. (B3) Predictions of the sequential two-step model (lines) for the time course of the fractional recovery of EPSCtest after 500 Hz conditioning trains superimposed onto experimental data for Rac1+/+ (black circles) and Rac1−/− (orange triangles) synapses (data from Figure 5A3). (B4) Predictions of the sequential two-step model (lines) for the time course of STP during 50 Hz and 500 Hz trains superimposed onto experimental data (circles) for Rac1+/+ (black, top panel) and Rac1−/− (orange, bottom panel) synapses. (B5) Model predictions for the time course of STP during 50 Hz and 500 Hz trains for Rac1+/+ (gray and black) and Rac1−/− (light and dark orange) synapses shown superimposed to facilitate comparison.


