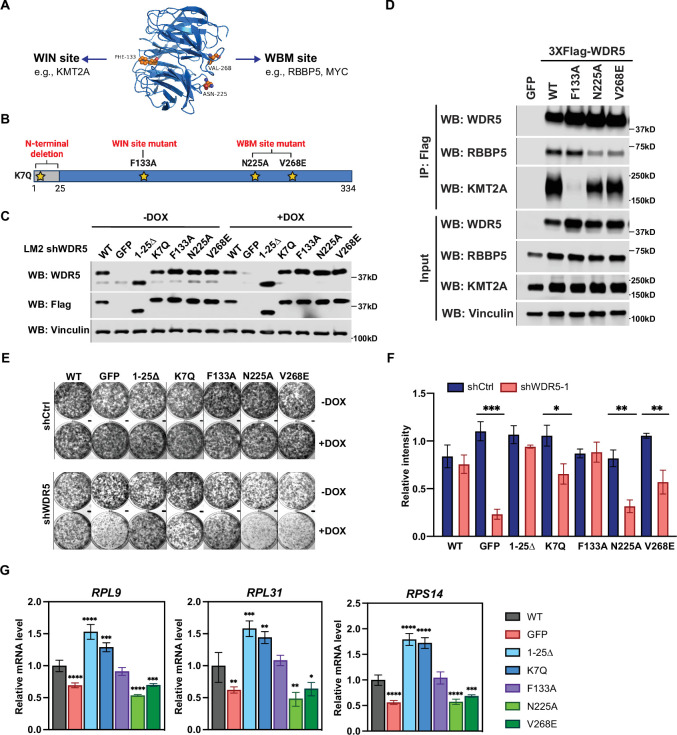
Figure 4. The WBM-binding sites are required for WDR5-dependent cell growth and ribosomal protein gene expression.
(A) WDR5 protein structure and key residues in the WIN and WBM sites that interact with binding partners. (B) Schematic of WDR5 with the indicated mutation sites. (C) Western blot analysis of the indicated proteins in LM2 inducible shWDR5 cells over-expressing wild-type (WT) WDR5 or WDR5 mutants. Cells were collected after 3 days of control or doxycycline (DOX) (1 μg/mL) induction. (D) Western blot analysis of the indicated proteins after immunoprecipitation using anti-Flag antibody in the LM2 shWDR5 cells over-expressing green fluorescent protein (GFP), WT WDR5, or WDR5 mutants. (E–F) Colony formation assays of cells expressing GFP, WT WDR5, or WDR5 mutants in inducible shControl (shCtrl) or shWDR5 cell lines after 9 days of control or DOX treatment. Representative images (E) and quantification (F) are shown. DOX-treated wells were compared to their respective controls for each cell line (n=3, unpaired two-side Student’s t test). pWT = 0.4047, ***pGFP = 0.0002, p1-25Δ=0.0854, *pK7Q=0.0104, pF133A=0.8448, **pN225A=0.0014, and **pV268E=0.0027. (G) RT-quantitative PCR analysis of the indicated mRNAs in LM2 from (E) induced with DOX (1 μg/mL) for 3 days. Significance determined by comparing each treatment to WT control (n=4, unpaired two-side Student’s t test). For RPL9, ****pGFP <0.0001, ****p1-25Δ<0.0001, ***pK7Q=0.0002, ****pN225A<0.0001, and ***pV268E=0.0006; for RPL31, **pGFP = 0.0045, ***p1-25Δ=0.0007, **pK7Q=0.0027, **pN225A=0.0027, and *pV268E=0.0307; for RPS14, ****pGFP <0.0001, ****p1-25Δ<0.0001, ****pK7Q<0.0001, ****pN225A<0.0001, and ***pV268E=0.0005. For gel source data, see Figure 4—source data 1 and Figure 4—source data 2.


