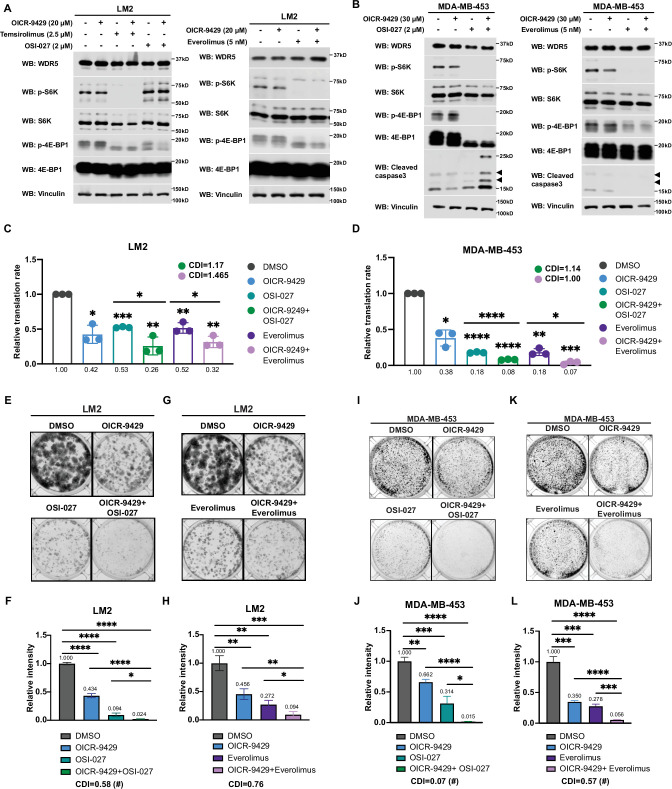
Figure 6. Inhibition of WDR5 and mTOR cooperatively reduces translation and triple-negative breast cancer (TNBC) cell growth.
(A) Western blot analysis of the indicated proteins in LM2 cells treated for 3 days with or without 20 μM OICR-9429 in combination with control, 2 μM OSI-027, 2.5 μM temsirolimus, or 5 nM everolimus. (B) Western blot analysis of the indicated proteins in MDA-MB-453 treated for 3 days with or without 30 μM OICR-9429 in combination with control, 0.5 μM OSI-027, or 1 nM everolimus. (C) Normalized translational rates in LM2 cells from (A) (n=3, one sample t test). *p=0.0166 (DMSO versus OICR-9429), ***p=0.0001 (DMSO versus OSI-027), ** p=0.0099 (DMSO versus OICR-9429 +OSI-027), **p=0.0080 (DMSO versus everolimus), **p=0.0047 (DMSO versus OICR-9429+), *p=0.0232 (OSI-027 versus OICR-9429 +OSI-027), and *p=0.00352 (everolimus versus OICR-9429 +everolimus). (D) Normalized translational rates in MDA-MB-453 cells from (B) (n=3, one sample t test). *p=0.0107 (DMSO versus OICR-9429), ****p<0.0001 (DMSO versus OSI-027), ****p<0.0001 (DMSO versus OICR-9429 +OSI-027), **p=0.0012 (DMSO versus everolimus), ***p=0.0005 (DMSO versus OICR-9429 +everolimus), ****p<0.0001 (OSI-027 versus OICR-9429 +OSI-027), and *p=0.0370 (everolimus versus OICR-9429 +everolimus). (E–F) Colony formation assay of LM2 treated for 8 days with or without 20 μM OICR-9429 in combination with control or 2 μM OSI-027. Representative images (E) and quantification (F) are shown. ****p<0.0001 (DMSO versus OICR-9429), ****p<0.0001 (DMSO versus OSI-027), ****p<0.0001 (DMSO versus OICR-9429 +OSI-027), ****p<0.0001 (OICR-9429 versus OICR-9429 +OSI-027), and *p=0.0233 (OSI-027 versus OICR-9429 +OSI-027). (G–H) Colony formation assay of LM2 cells treated for 8 days with or without 20 μM OICR-9429 in combination with control or 5 nM everolimus. Representative images (G) and quantification (H) are shown. **p=0.0043 (DMSO versus OICR-9429), **p=0.0011 (DMSO versus everolimus), ***p=0.0004 (DMSO versus OICR-9429 +everolimus), **p=0.0042 (OICR-9429 versus OICR-9429 +everolimus), and *p=0.0272 (everolimus versus OICR-9429 +everolimus). (I–J) Colony formation assay of MDA-MB-453 treated for 10 days with or without 30 μM OICR-9429 in combination with control or 0.5 μM OSI-027. Representative images (I) and quantification (J) are shown. **p=0.0018 (DMSO versus OICR-9429), ***p=0.0009 (DMSO versus OSI-027), ****p<0.0001 (DMSO versus OICR-9429 +OSI-027), ****p<0.0001 (OICR-9429 versus OICR-9429 +OSI-027), and *p=0.011 (OSI-027 versus OICR-9429 +OSI-027). (K–L) Colony formation assay of MDA-MB-453 cells treated for 10 days with or without 30 μM OICR-9429 in combination with control or 1 nM everolimus. Representative images (K) and quantification (L) are shown (n=3, unpaired two-side Student’s t test). ***p=0.0002 (DMSO versus OICR-9429), ***p=0.0002 (DMSO versus everolimus), ****p<0.0001 (DMSO versus OICR-9429 +everolimus), ****p<0.0001 (OICR-9429 versus OICR-9429 +everolimus), and ***p=0.0003 (everolimus versus OICR-9429 +everolimus). Calculation of coefficients of drug interaction (CDIs) is described in Materials and methods section. Significant synergy is labeled with (#). For gel source data, see Figure 6—source data 1 and Figure 6—source data 2.


