Graphical Abstract.
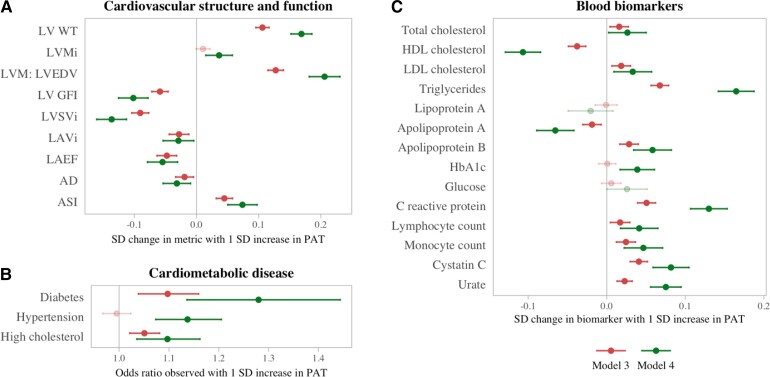
Associations of PAT with cardiovascular structure and function (A), cardiometabolic disease (B), and blood biomarkers (C). The red lines represent the model adjusted for vascular risk factors, demographic factors, body mass index and waist-hip ratio (Model 3); the green lines represent the model adjusted for vascular risk factors, demographic factors, and adiposity PCA scores (Model 4). Panel A: SD change in cardiovascular measure per SD increase in (log) PAT. Panel B: Change in cardiometabolic disease odds per SD increase in (log) PAT. Panel C: SD change in blood biomarker level per SD increase in (log) PAT. AD, aortic distensibility; ASI, arterial stiffness index; CRP, C-reactive protein; HbA1c, glycated haemoglobin A1C; HDL, high-density lipoprotein; LAEF, left atrium ejection fraction; LAVi, left atrial maximum area index; LDL, low-density lipoprotein; LV GFI, left ventricular global function index; LVMi, left ventricular mass index; LVM:LVEDV, ratio of left ventricular mass to left ventricular end-diastolic volume; LVSVi, left ventricular stroke volume index; LV WT, left ventricular wall thickness; PAT, pericardial adipose tissue, PCA, principal component analysis; SD, standard deviation

