Figure 1.
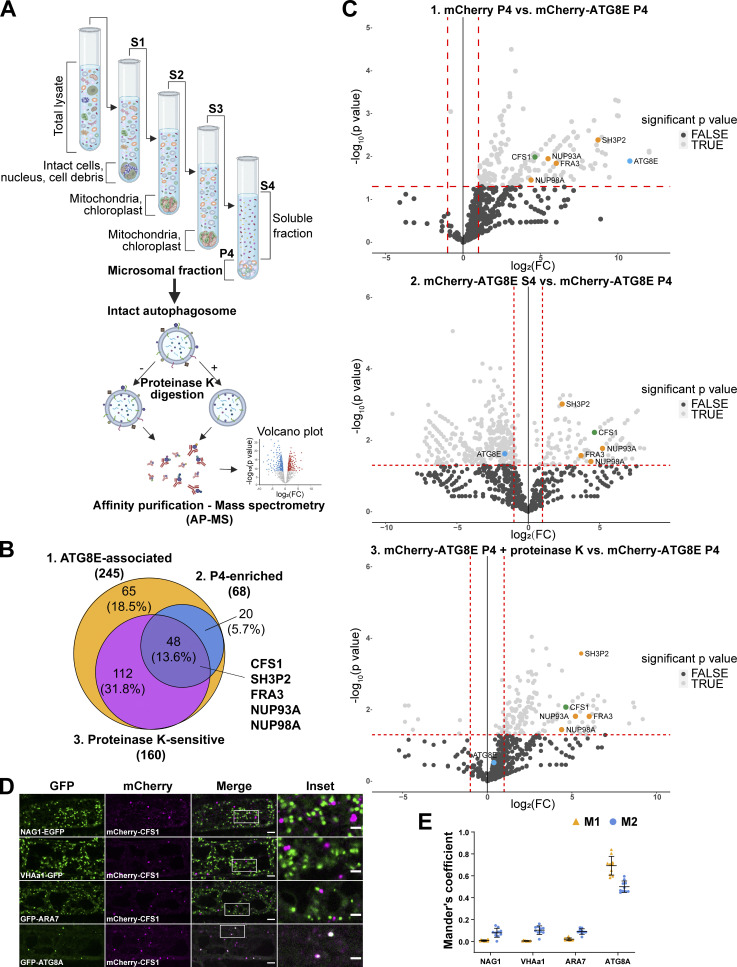
Differential centrifugation coupled to affinity purification-mass spectrometry (AP-MS) revealed autophagosome-associated proteins in A. thaliana. (A) Schematic diagram showing the differential centrifugation coupled to affinity purification-mass spectrometry (AP-MS) workflow. Total lysate of Arabidopsis seedlings underwent several differential centrifugation steps, where each time the supernatant (S) was transferred, and the pellet (P) was left untouched. Samples were spun for 10 min at 1,000 g (S1), to remove intact cells, nuclei, and cell debris; 10 min at 10,000 g, to remove bigger organelles like mitochondria and chloroplasts (S2); 10 min at 15,000 g, to further remove organelles (S3) and finally 60 min at 100,000 g (S4 and P4; LaMontagne et al., 2016). The P4 fraction, containing small vesicles and microsomes (microsomal fraction), i.e., autophagosomes, was further subjected to 30 ng/μl proteinase K treatment (P4 + proteinase K). All S4, P4, and P4 + proteinase K samples were processed for AP-MS. (B) Venn diagram showing the overlap between ATG8E-associated, P4-enriched, and protease K-sensitive proteins that were identified by the AP-MS workflow described in A. 7-d-old Arabidopsis seedlings expressing pUBQ::mCherry or pUBQ::mCherry-ATG8E were treated with 3 μM Torin 1 for 90 min for autophagy induction before lysing. Diagram was generated using Venny 2.1.0 (Oliveros, 2016). (C) Volcano plots of mCherry-ATG8E AP-MS datasets identified CFS1 in all three pairwise comparisons. Upper panel, volcano plot of the pairwise comparison of “mCherry P4” and “mCherry-ATG8E P4” shows proteins enriched by the bait mCherry-ATG8E. X- and Y-axis displays log2 fold-change (log2[FC]) and −log10(P value), respectively. Dashed lines represent threshold for log2(FC) > 1 and P value <0.05. Only proteins passing both P value <0.05 and log2(FC) < 0 filter were considered in the first set “ATG8E-associated” in B. Middle panel, volcano plot of the pairwise comparison of “mCherry-ATG8E S4” and “mCherry-ATG8E P4,” shows proteins enriched by mCherry-ATG8E in the pellet (P4) relative to the supernatant (S4). X-axis and Y-axis display log2(FC) and −log10(P value), respectively. Dashed lines represent threshold for log2(FC) > 1 and P value <0.05. Only proteins passing both P value <0.05 and log2(FC) < 0 filter were considered in the second set “P4-enriched” in B. Lower panel, volcano plot of the pairwise comparison of “mCherry-ATG8E P4 + proteinase K” and “mCherry-ATG8E P4”, shows proteins enriched by mCherry-ATG8E in the pellet (P4) before proteinase K treatment. X-axis and Y-axis display log2(FC) and −log10(P value), respectively. Dashed lines represent threshold for log2(FC) > 1 and P value <0.05. Only proteins passing both P value <0.05 and log2(FC) < 0 filter were considered in the third set “Proteinase K-sensitive” in B. For all volcano plots, CFS1, interested proteins, and ATG8E are labeled by green, orange, or light blue dots, respectively. (D) Confocal microscopy images of Arabidopsis root epidermal cells co-expressing pUBQ::mCherry-CFS1 with either Golgi body marker p35S::NAG1-EGFP, trans-Golgi network marker pa1::VHAa1-GFP, MVB marker pRPS5a::GFP-ARA7 or autophagosome marker pUBQ::GFP-ATG8A under nitrogen starvation. 5-d-old Arabidopsis seedlings were incubated in nitrogen-deficient 1/2 MS media for 4 h for autophagy induction before imaging. Representative images of 10 replicates are shown. Area highlighted in the white-boxed region in the merge panel was further enlarged and presented in the inset panel. Scale bars, 5 μm. Inset scale bars, 2 μm. (E) Quantification of confocal experiments in D showing the Mander’s colocalization coefficients between mCherry-CFS1 and the GFP-fused marker proteins NAG1, VHAa1, ARA7, or ATG8A. M1, fraction of GFP-fused marker signal that overlaps with mCherry-CFS1 signal. M2, fraction of mCherry-CFS1 signal that overlaps with GFP-fused marker signal. Bars indicate the mean ± SD of 10 replicates.

