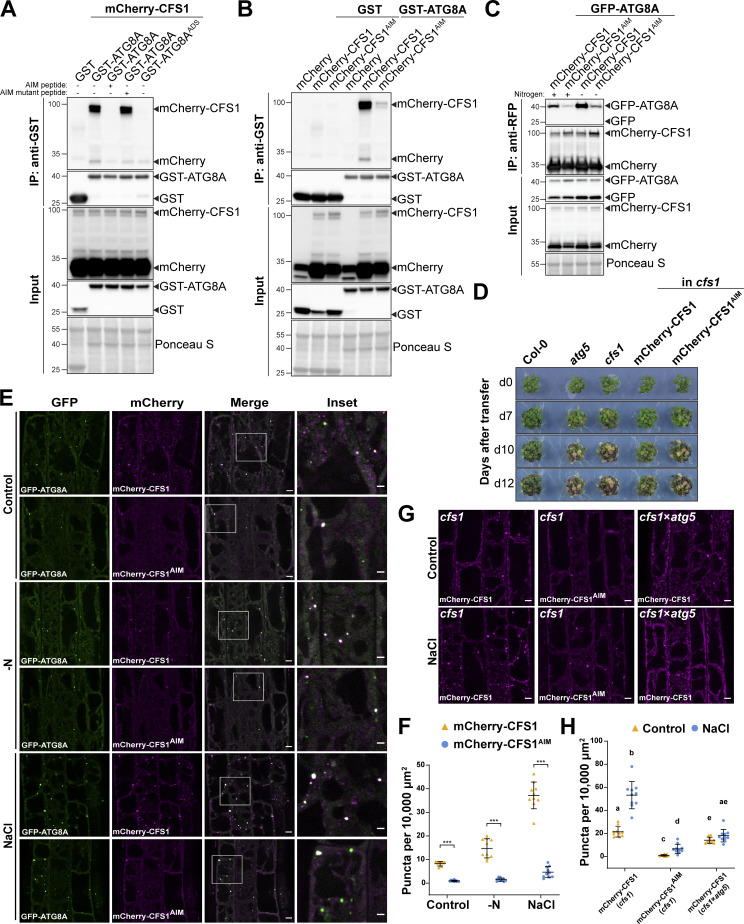
Figure 2.
CFS1 interacts with ATG8A in an AIM (ATG8 Interacting Motif)-dependent manner. (A) GST pull-down coupled with peptide competition with E. coli lysates expressing either GST, GST-ATG8A, or GST-ATG8AADS and A. thaliana whole-seedling lysates expressing mCherry-CFS1. The peptides were added to a final concentration of 200 µM. Proteins were visualized by immunoblotting with anti-GST and anti-RFP antibodies. Representative images of three replicates are shown. Reference protein sizes are labeled as numbers at the left side of the blots (unit: kD). ADS, AIM docking site. (B) GST pull-down with E. coli lysates expressing either GST or GST-ATG8A and A. thaliana whole-seedling lysates expressing either mCherry, mCherry-CFS1, or mCherry-CFS1AIM. Proteins were visualized by immunoblotting with anti-GST and anti-RFP antibodies. Representative images of three replicates are shown. Reference protein sizes are labeled as numbers at the left side of the blots (unit: kD). (C) RFP-Trap pull-down of Arabidopsis seedlings co-expressing pUBQ::GFP-ATG8A with either pUBQ::mCherry-CFS1 or pUBQ::mCherry-CFS1AIM. 7-d-old seedlings were incubated in either control (+) or nitrogen-deficient (−) 1/2 MS media for 12 h. Protein extracts were immunoblotted with anti-GFP and anti-RFP antibodies. Representative images of four replicates are shown. Reference protein sizes are labeled as numbers at the left side of the blots (unit: kD). (D) Phenotypic characterization of Col-0, atg5, cfs1, cfs1 complemented with pUBQ::mCherry-CFS1 or cfs1 complemented with pUBQ::mCherry-CFS1AIM upon nitrogen starvation. 25 seeds per genotype were grown on 1/2 MS media plates (+1% plant agar) for 1-wk and 7-d-old seedlings were subsequently transferred to nitrogen-deficient 1/2 MS media plates (+0.8% plant agar) and grown for 2 wk. Plants were grown at 21°C under LEDs with 85 µM/m2/s and a 14 h light/10 h dark photoperiod. d0 depicts the day of transfer. Brightness of pictures was enhanced ≤19% with Adobe Photoshop (2020). Representative images of four replicates are shown. (E) Confocal microscopy images of Arabidopsis root epidermal cells co-expressing pUBQ::GFP-ATG8A with either pUBQ::mCherry-CFS1 or pUBQ::mCherry-CFS1AIM. 5-d-old Arabidopsis seedlings were incubated in either control, nitrogen-deficient (−N) or 150 mM NaCl-containing 1/2 MS media before imaging. Representative images of 10 replicates are shown. Area highlighted in the white-boxed region in the merge panel was further enlarged and presented in the inset panel. Scale bars, 5 μm. Inset scale bars, 2 μm. (F) Quantification of confocal experiments in E showing the number of mCherry-CFS1 puncta per normalized area (10,000 μm2). Bars indicate the mean ± SD of 10 replicates. Two-tailed and paired Student t tests were performed to analyze the significance differences of the mCherry-CFS1 puncta number. ***, P value <0.001. (G) Confocal microscopy images of root epidermal cells of cfs1 expressing pUBQ::mCherry-CFS1 or pUBQ::mCherry-CFS1AIM, or cfs1 × atg5 expressing pUBQ::mCherry-CFS1. 5-d-old Arabidopsis seedlings were incubated in either control or 150 mM NaCl-containing 1/2 MS media for 2 h before imaging. Representative images of 10 replicates are shown. Scale bars, 5 μm. (H) Quantification of confocal experiments in G showing the number of mCherry-CFS1 puncta per normalized area (10,000 μm2). Bars indicate the mean ± SD of 10 replicates. Brown–Forsythe and Welch one-way ANOVA test were performed to analyze the differences of the mCherry-CFS1 puncta number between each group. Unpaired t tests with Welch’s correction were used for multiple comparisons. Family-wise significance and confidence level, 0.05 (95% confidence interval), were used for analysis. Source data are available for this figure: SourceData F2.

