Figure 3.
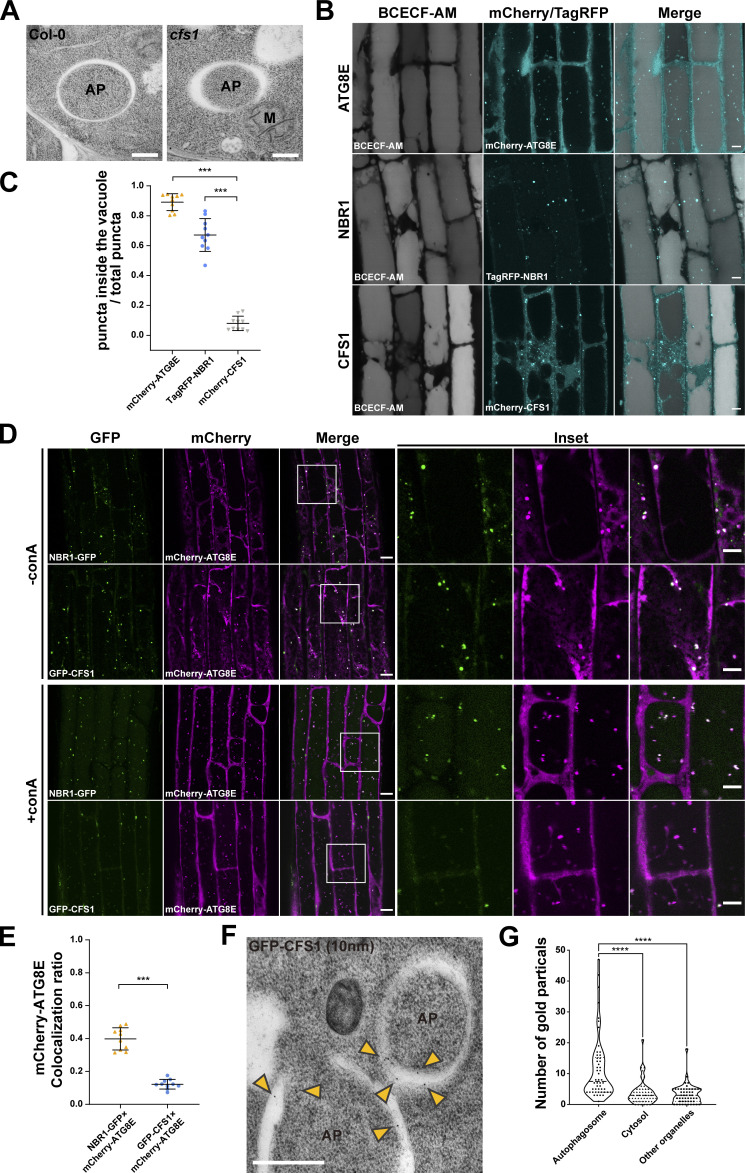
CFS1 functions as an autophagy adaptor. (A) Transmission electron microscopy (TEM) micrographs showing fully formed autophagosomes in the root cells of Col-0 and cfs1. 7-d-old Arabidopsis seedlings were incubated in 150 mM NaCl-containing 1/2 MS media for 1 h for autophagy induction before cryofixation. Scale bars, 500 nm. AP, autophagosome. M, mitochondrion. (B) Confocal microscopy images of Arabidopsis root epidermal cells expressing either pUBQ::mCherry-ATG8E, pNBR1::TagRFP-NBR1 or pUBQ::mCherry-CFS1. 5-d-old seedlings were first incubated in 5 μM BCECF-AM-containing 1/2 MS media for 30 min for vacuole staining and were subsequently transferred to 1/2 MS media containing 90 mM NaCl and 1 μM concanamycin A (conA) for 2 h before imaging. Representative images of 10 replicates are shown. Scale bars, 5 μm. (C) Quantification of confocal experiments in B showing the ratio between the number of mCherry-ATG8E, TagRFP-NBR1, or mCherry-CFS1 puncta inside the vacuole, compared to the total number of mCherry-ATG8E, TagRFP-NBR1, or mCherry-CFS1 puncta. Bars indicate the mean ± SD of 10 replicates. Two-tailed and unpaired t tests with Welch’s corrections were performed to analyze the differences of puncta numbers between mCherry-ATG8E and mCherry-CFS1 or between TagRFP-NBR1 and mCherry-CFS1. ***, P value <0.001. (D) Confocal microscopy images of Arabidopsis root epidermal cells co-expressing pUBQ::mCherry-ATG8E with either pUBQ::GFP-CFS1 or pNBR1::NBR1-GFP. 5-d-old Arabidopsis seedlings were incubated in 1/2 MS media containing either 150 mM NaCl (without conA; -conA), or 90 mM NaCl and 1 μM conA (+conA) for 2 h before imaging. Representative images of 10 replicates are shown. Area highlighted in the boxed region in the merge panel was further enlarged and presented in the inset panel. Scale bars, 10 μm. Inset scale bars, 5 μm. (E) Quantification of confocal experiments in D showing the mCherry-ATG8E colocalization ratio of NBR1-GFP and GFP-CFS1 to mCherry-ATG8E under +conA treatment conditions. The mCherry-ATG8E colocalization ratio is calculated as the ratio between the number of mCherry-ATG8E puncta that colocalize with NBR1-GFP or GFP-CFS1 puncta compared with the number of total mCherry-ATG8E puncta. Bars indicate the mean ± SD of 10 replicates. Two-tailed and unpaired t tests with Welch’s corrections were performed to analyze the differences of mCherry-ATG8E colocalization ratio between GFP-CFS1 and NBR1-GFP. ***, P value <0.001. (F) TEM images showing immuno-gold labeled GFP-CFS1 at the autophagosomes in Arabidopsis root cells. 7-d-old seedlings were incubated in 150 mM NaCl-containing 1/2 MS media for 2 h for autophagy induction before cryofixation. Sections from pUBQ::GFP-CFS1 expressing samples were labeled with an anti-GFP primary antibody and a secondary antibody conjugated to 10 nm gold particles. Yellow arrowheads mark the gold particles associated with autophagosomes. Scale bars, 500 nm. AP, autophagosome. (G) Quantification of the localization of the GFP-specific gold particles imaged in the experiment shown in F. Approximately 900 gold particles in 50 TEM images captured from five independent samples were grouped into autophagosomes, cytosol or other organelles according to their locations. One-way ANOVA was performed to analyze the significant difference between different gold particle locations. ****, P value <0.0001.

