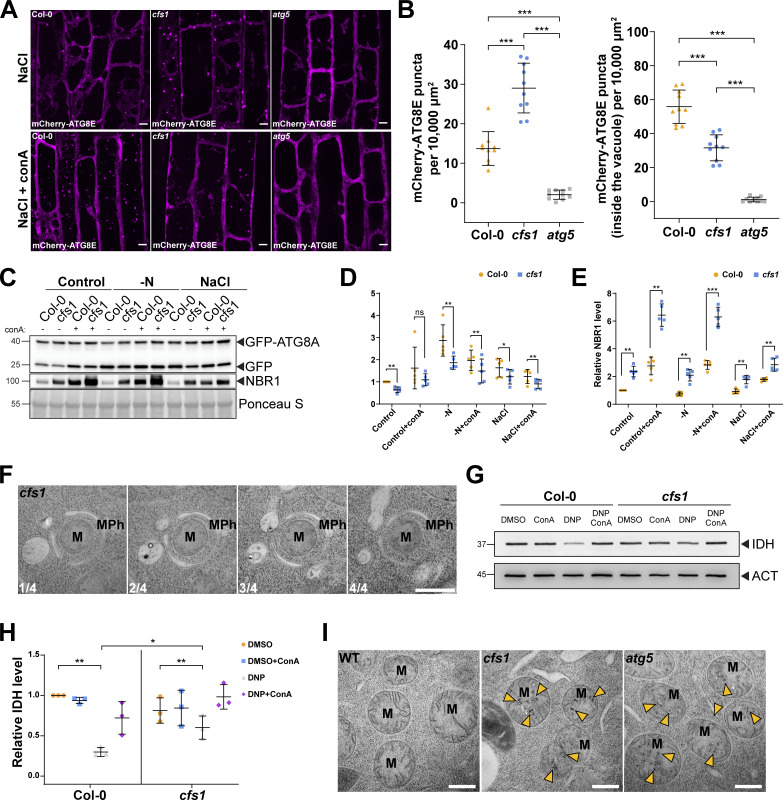
Figure 4.
CFS1 is crucial for autophagic flux in A. thaliana. (A) Confocal microscopy images of root epidermal cells of Col-0, cfs1, or atg5 expressing pUBQ::mCherry-ATG8E under NaCl or NaCl + conA treatment. 5-d-old Arabidopsis seedlings were incubated in 1/2 MS media containing either 150 mM NaCl (NaCl) or 90 mM NaCl and 1 μM conA (NaCl + conA) for 2 h before imaging. Representative images of 10 replicates are shown. Scale bars, 5 μm. (B) Left panel, quantification of the mCherry-ATG8E puncta per normalized area (10,000 μm2) of the NaCl-treated cells imaged in A. Right panel, quantification of the mCherry-ATG8E puncta inside the vacuole per normalized area (10,000 μm2) of the NaCl + conA-treated cells imaged in A. Bars indicate the mean ± SD of 10 replicates. Two-tailed and unpaired Student t tests with Welch’s correction were performed to analyze the significance of mCherry-ATG8E puncta density differences between Col-0 and cfs1, Col-0 and atg5, or cfs1 and atg5. ***, P value <0.001. (C) Western blots showing GFP-ATG8A cleavage level and endogenous NBR1 level in Col-0 or cfs1 mutants under control, nitrogen-deficient (−N) or salt-stressed (NaCl) conditions. Arabidopsis seedlings were grown under continuous light in 1/2 MS media for 1-wk and 7-d-old seedlings were subsequently transferred to 1/2 MS media ±1 µM conA, nitrogen-deficient (−N) 1/2 MS media ±1 µM conA, or 1/2 MS media containing 150 mM NaCl ±1 µM conA for 12 h. 15 μg of total protein extract was loaded and immunoblotted with anti-GFP and anti-NBR1 antibodies. Representative images of five replicates are shown. Reference protein sizes are labeled as numbers at the left side of the blots (unit: kD). (D) Quantification of the relative autophagic flux in C. Values were calculated through protein band intensities of GFP divided by GFP-ATG8A and normalized to untreated (Control) Col-0. Results are shown as the mean ± SD of five replicates. One-tailed and paired Student t tests were performed to analyze the significance of the relative autophagic flux differences. ns, not significant. *, P < 0.05. **, P < 0.01. (E) Quantification of the relative NBR1 level in C compared to untreated (control) Col-0. Values were calculated through normalization of protein bands to Ponceau S and shown as the mean ± SD of five replicates. One-tailed and paired Student t tests were performed to analyze the significance of the relative NBR1 level differences. **, P < 0.01. ***, P < 0.001. (F) Serial sections of transmission electron microscopy micrographs showing a mitophagosome engulfing a mitochondrion. 7-d-old Arabidopsis cfs1 seedlings were incubated in 1/2 MS media containing 50 μM DNP for 1 h before cryofixation. Scale bar, 500 nm. MPh, mitophagosome. M, mitochondrion. (G) Immunoblot assay of uncoupler-induced mitochondrial protein degradation in Arabidopsis Col-0 and cfs1 seedlings. 7-d-old seedlings were incubated in 1/2 MS media containing 50 μM DNP ±1 μM conA for 4 h before protein extraction. A mitochondrial matrix protein, isocitrate dehydrogenase (IDH), was immunoblotted by anti-IDH antibodies. Actin (ACT) was immunoblotted by anti-ACT antibodies and was used as a loading control. Representative images of three replicates are shown. Reference protein sizes are labeled as numbers at the left side of the blots (unit: kD). (H) Quantification of relative IDH intensities in G compared to untreated (control) Col-0. Values were calculated via normalization of protein bands to ACT and shown as the mean ± SD of three replicates. One-tailed and paired Student’s t tests were performed to analyze the significance of the relative IDH level differences. ns, not significant. *, P < 0.05. **, P < 0.01. (I) TEM micrographs of mitochondria in Arabidopsis Col-0, cfs1 and atg5 root cells. 7-d-old seedlings were incubated in 150 mM NaCl-containing 1/2 MS media for 2 h for autophagy induction before cryofixation. Yellow arrowheads mark the distinctive electron dense precipitates of compromised mitochondria that appear after NaCl treatment. Scale bars, 500 nm. M, mitochondria. Source data are available for this figure: SourceData F4.

