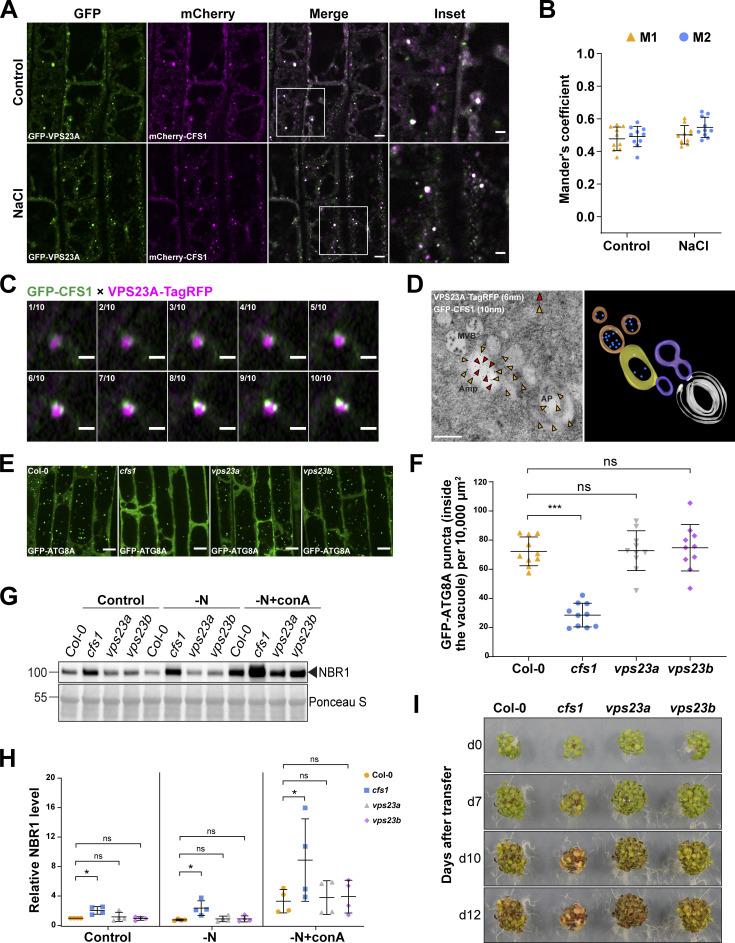
Figure 7.
Functional analysis of CFS1-VPS23 interaction revealed the amphisome in A. thaliana. (A) Confocal microscopy images of Arabidopsis root epidermal cells co-expressing pUBQ::mCherry-CFS1 with pUBQ::GFP-VPS23A. 5-d-old Arabidopsis seedlings were incubated in either control or 150 mM NaCl-containing 1/2 MS media for 1 h before imaging. Representative images of 10 replicates are shown. Area highlighted in the white-boxed region in the merge panel was further enlarged and presented in the inset panel. Scale bars, 5 μm. Inset scale bars, 2 μm. (B) Quantification of confocal experiments in A showing the Mander’s colocalization coefficients between mCherry-CFS1 and GFP-VPS23A. M1, fraction of GFP-VPS23A signal that overlaps with mCherry-CFS1 signal. M2, fraction of mCherry-CFS1 signal that overlaps with GFP-VPS23A signal. Bars indicate the mean ± SD of 10 replicates. (C) Airyscan time-lapse microscopy images of Arabidopsis root epidermal cells showing the partial colocalization between GFP-CFS1 and VPS23A-TagRFP. 5-d-old Arabidopsis seedlings co-expressing pVPS23A::VPS23A-TagRFP and pUBQ::GFP-CFS1 were incubated in 150 mM NaCl-containing 1/2 MS media for 1 h for autophagy induction before imaging. 10 continuous layers from one Z-stack image are shown separately in order. Interval of the Z-stack image, 0.15 μm. Scale bars, 1 μm. (D) Left panel, transmission electron microscopy micrographs showing the colocalization of VPS23A-TagRFP and GFP-CFS1 in Arabidopsis root cells co-expressing pVPS23A::VPS23A-TagRFP and pUBQ::GFP-CFS1. 5-d-old seedlings were incubated in 150 mM NaCl-containing 1/2 MS media for 2 h for autophagy induction before cryofixation. Sections were labeled with rabbit anti-RFP and chicken anti-GFP primary antibodies and secondary antibodies conjugated to 6- or 10-nm gold particles. Yellow and red arrowheads mark the representative RFP and GFP-specific gold particles, respectively. MVB, multivesicular bodies; Amp, amphisome; AP, autophagosome. Scale bars, 400 nm. Right panel, the three-dimensional model of the amphisome and its associated compartments shown in the left panel. The model was generated from serial sections flanking the section shown in the left panel. Autophagosome (white), autophagosome-associated vesicles (purple), amphisome (yellow), multivesicular bodies (orange), and internal vesicles (blue) were rendered into 3D surfaces. (E) Confocal microscopy images of root epidermal cells of Col-0, cfs1, vps23a, or vps23b seedlings expressing pUBQ::GFP-ATG8A under NaCl + concanamycin A (conA) treatment. 5-d-old Arabidopsis seedlings were incubated in 1/2 MS media containing 90 mM NaCl and 1 μΜ conA for 2 h before imaging. Representative images of 10 replicates are shown. Scale bars, 10 μm. (F) Quantification of the number of GFP-ATG8A puncta inside the vacuole per normalized area (10,000 μm2) of the cells imaged in E. Bars indicate the mean ± SD of 10 replicates. Two-tailed and unpaired Student t tests were performed to analyze the significance of GFP-ATG8A puncta density differences between Col-0 and cfs1, Col-0 and vps23a, or Col-0 and vps23b. ns, not significant. ***, P value <0.001. (G) Western blot showing the endogenous NBR1 level in Col-0, cfs1, vps23a, or vps23b under control or nitrogen-deficient ± conA conditions. Arabidopsis seeds were first grown in 1/2 MS media under continuous light for 1-wk and 7-d-old seedlings were subsequently transferred to 1/2 MS media (Control), nitrogen-deficient 1/2 MS media (−N) or nitrogen-deficient 1/2 MS media containing 1 µM conA (−N + conA) for 12 h. 10 μg of total protein extract was loaded and immunoblotted with anti-NBR1 antibodies. Representative images of four replicates are shown. Reference protein sizes are labeled as numbers at the left side of the blots (unit: kD). (H) Quantification of the relative NBR1 level in G compared to untreated (control) Col-0. Values were normalized to untreated (Control) Col-0 and calculated through normalization of protein bands to Ponceau S and shown as the mean ± SD of four replicates. One-tailed and paired Student t tests were performed to analyze the significance of the relative NBR1 level difference. ns, not significant. *, P < 0.05. (I) Phenotypic characterization of Arabidopsis cfs1, vps23a, and vps23b mutants during nitrogen starvation. 25 seeds per genotype were grown on 1/2 MS media plates (+1% plant agar) for 1-wk and 7-d-old seedlings were subsequently transferred to nitrogen-deficient 1/2 MS media plates (+0.8% plant agar) and grown for 2 wk. Plants were grown at 21°C under LEDs with 85 µM/m2/s and a 14 h light/10 h dark photoperiod. d0 depicts the day of transfer. Brightness of pictures was enhanced ≤30% with Adobe Photoshop (2020). Representative images of four replicates are shown. Source data are available for this figure: SourceData F7.

