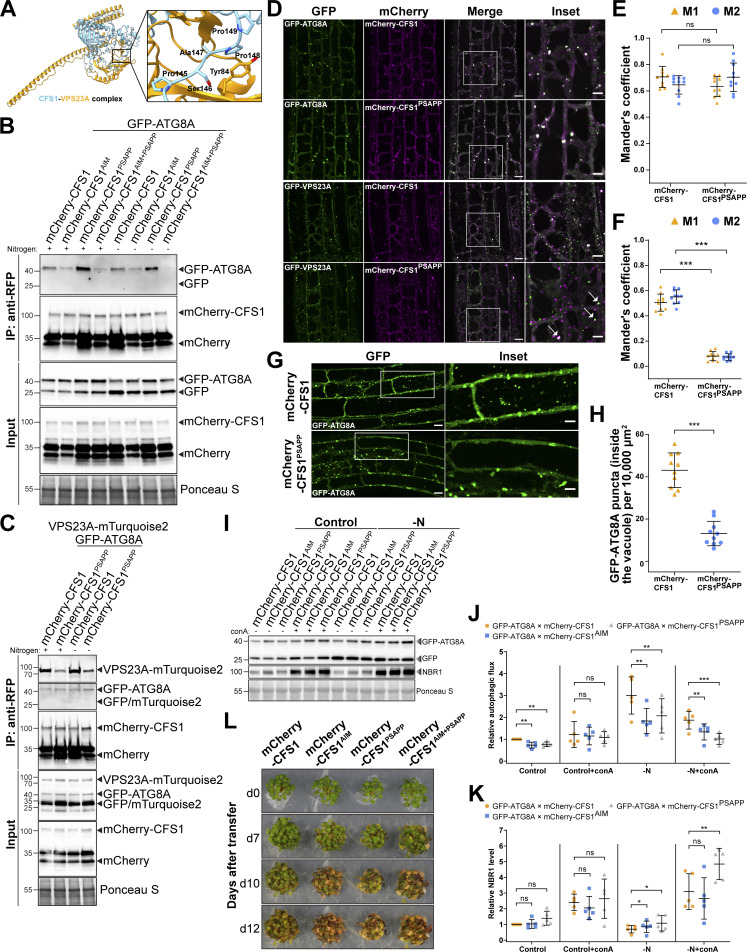
Figure 8.
PSAPP motif of CFS1 is crucial for CFS1-VPS23A interaction and autophagic flux. (A) Homology modeling of CFS1/VPS23A complex. Prediction of CFS1-VPS23A heterocomplex formation generated by AlphaFold2 as implemented by ColabFold (Jumper et al., 2021; Mirdita et al., 2022). Structure of CFS1 and VPS23A is represented as ribbons and colored in light blue and orange, respectively. The predicted complex interaction interface involving AtCFS1 PSAPP motif is highlighted as a zoom in with the side chains of relevant residues represented as sticks. (B) RFP-Trap pull-down of Arabidopsis seedlings co-expressing pUBQ::GFP-ATG8A with either pUBQ::mCherry-CFS1, pUBQ::mCherry-CFS1AIM, pUBQ::mCherry-CFSPSAPP or pUBQ::mCherry-CFS1AIM+PSAPP. 7-d-old seedlings were incubated in either control (+) or nitrogen-deficient (−) 1/2 MS media for 12 h. Protein extracts were immunoblotted with anti-GFP and anti-RFP antibodies. Representative images of two replicates are shown. Reference protein sizes are labeled as numbers at the left side of the blots (unit: kD). (C) RFP-Trap pull-down of Arabidopsis seedlings co-expressing pUBQ::GFP-ATG8A and pUBQ::VPS23A-mTurquoise2 with either pUBQ::mCherry-CFS1 or pUBQ::mCherry-CFS1PSAPP. 7-d-old seedlings were incubated in either control (+) or nitrogen-deficient (−) 1/2 MS media for 12 h. Protein extracts were immunoblotted with anti-GFP and anti-RFP antibodies. Representative images of two replicates are shown. Reference protein sizes are labeled as numbers at the left side of the blots (unit: kD). (D) Confocal microscopy images of Arabidopsis root epidermal cells co-expressing either pUBQ::GFP-ATG8A or pUBQ::GFP-VPS23A with either pUBQ::mCherry-CFS1 or pUBQ::mCherry-CFS1PSAPP under salt stress. 5-d-old Arabidopsis seedlings were incubated in 150 mM NaCl-containing media for 1 h for autophagy induction before imaging. Representative images of 10 replicates are shown. Area highlighted in the white-boxed region in the merge panel was further enlarged and presented in the inset panel. Arrows point out the partial colocalization of GFP-VPS23A puncta and mCherry-CFS1PSAPP puncta. Scale bars, 10 μm. Inset scale bars, 5 μm. (E) Quantification of confocal experiments in (D) showing the Mander’s colocalization coefficients between GFP-ATG8A and either mCherry-CFS1 or mCherry-CFS1PSAPP. M1, fraction of GFP-ATG8A signal that overlaps with mCherry-CFS1 or mCherry-CFS1PSAPP signal. M2, fraction of mCherry-CFS1 or mCherry-CFS1PSAPP signal that overlaps with GFP-ATG8A signal. Bars indicate the mean ± SD of 10 replicates. (F) Quantification of confocal experiments in D showing the Mander’s colocalization coefficients between GFP-VPS23A and either mCherry-CFS1 or mCherry-CFS1PSAPP. M1, fraction of GFP-VPS23A signal that overlaps with mCherry-CFS1 or mCherry-CFS1PSAPP signal. M2, fraction of mCherry-CFS1 or mCherry-CFS1PSAPP signal that overlaps with GFP-VPS23A signal. Bars indicate the mean ± SD of 10 replicates. (G) Confocal microscopy images of Arabidopsis root epidermal cells co-expressing pUBQ::GFP-ATG8A with either pUBQ::mCherry-CFS1 or pUBQ::mCherry-CFS1PSAPP under NaCl + concanamycin A (conA) treatment. 5-d-old Arabidopsis seedlings were incubated in 1/2 MS media containing 90 mM NaCl and 1μΜ conA for 2 h before imaging. Scale bars, 10 μm. Inset scale bars, 5 μm. (H) Quantification of GFP-ATG8A puncta inside the vacuole per normalized area (10,000 μm2) of the cells imaged in G. Bars indicate the mean ± SD of 10 replicates. Two-tailed and unpaired Student’s t test were performed to analyze the significance of difference between mCherry-CFS1 and mCherry-CFS1PSAPP. ***, P value <0.001. (I) Western blots showing the GFP-ATG8A cleavage level and the endogenous NBR1 level in Arabidopsis cfs1 mutants co-expressing pUBQ::GFP-ATG8A with either pUBQ::mCherry-CFS1, pUBQ::mCherry-CFS1AIM, or pUBQ::mCherry-CFS1PSAPP under control ± conA or nitrogen-deficient (−N) ± conA conditions. Arabidopsis seeds were first grown in 1/2 MS media under continuous light for 1-wk and 7-d-old seedlings were subsequently transferred to 1/2 MS media ±1 µM conA or nitrogen-deficient 1/2 MS media ±1 µM conA for 12 h. 10 μg of total protein extract was loaded and immunoblotted with anti-GFP and anti-NBR1 antibodies. Representative images of five replicates are shown. Reference protein sizes are labeled as numbers at the left side of the blots (unit: kD). (J) Quantification of I showing the relative autophagic flux. Values were calculated as the protein band intensities of GFP divided by the protein band intensity of GFP-ATG8A and were normalized to untreated (Control) Col-0. Results are shown as the mean ± SD of five replicates. One-tailed and paired Student’s t tests were performed to analyze the significance of the relative autophagic flux differences. ns, not significant. **, P < 0.01. ***, P < 0.001. (K) Quantification of I showing the relative NBR1 level in respect to untreated (Control) Col-0. Values were calculated through normalization of protein bands to Ponceau S and shown as the mean ± SD of five replicates. One-tailed and paired Student t tests were performed to analyze the significance of the relative NBR1 level difference. ns, not significant. *, P < 0.05. **, P < 0.01. (L) Phenotypic characterization of Arabidopsis cfs1 mutants complemented with either pUBQ::mCherry-CFS1, pUBQ::mCherry-CFS1AIM, pUBQ::mCherry-CFS1PSAPP, or pUBQ::mCherry-CFS1AIM+PSAPP upon nitrogen starvation. 25 seeds per genotype were grown on 1/2 MS media plates (+1% plant agar) for 1-wk and 7-d-old seedlings were subsequently transferred to nitrogen-deficient 1/2 MS media plates (+0.8% plant agar) and grown for 2 wk. Plants were grown at 21°C under LEDs with 85 µM/m2/s and a 14 h light/10 h dark photoperiod. d0 depicts the day of transfer. Brightness of pictures was enhanced ≤19% with Adobe Photoshop (2020). Representative images of four replicates are shown. Source data are available for this figure: SourceData F8.

