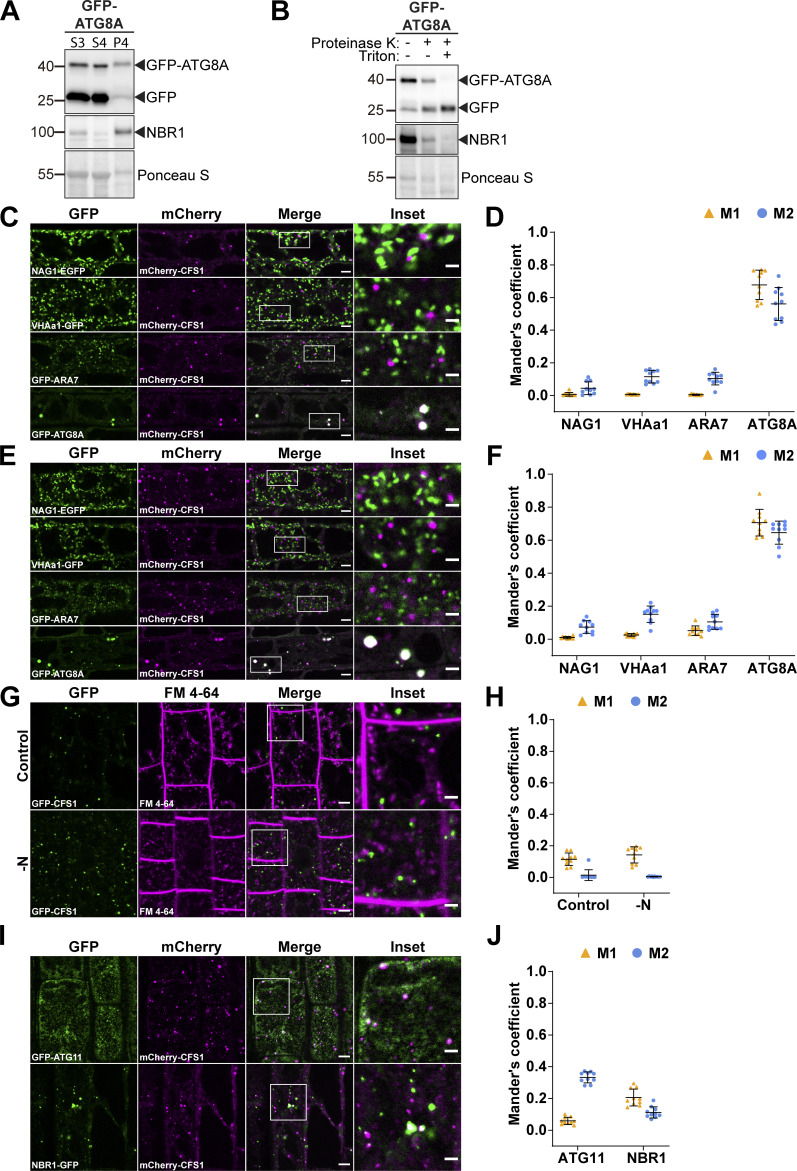
Figure S1.
Differential centrifugation coupled to affinity purification-mass spectrometry (AP-MS) revealed CFS1 as an autophagosome-associated protein in A. thaliana. (A and B) Ultracentrifugation enriches for intact autophagosomes. (A) Western blot analysis of 7-d-old Col-0 seedlings expressing pUBQ::GFP-ATG8A. Arabidopsis seedlings were treated with 3 μM Torin 1 for 90 min prior to differential centrifugation described in Fig. 1 A. A total of 5 μg of protein was loaded in each lane. Protein extracts were immunoblotted with anti-GFP and anti-NBR1 antibodies. Representative images of four replicates are shown. Reference protein sizes are labeled as numbers at the left side of the blots (unit: kD). (B) Protease protection assay of enriched autophagosomes in A. Autophagosomes were treated with 30 ng/μl proteinase K in the absence or presence of 1% Triton X-100. A total of 5 μg of protein was loaded in each lane. Protein extracts were immunoblotted with anti-GFP and anti-NBR1 antibodies. Representative images of 4 replicates are shown. Reference protein sizes are labeled as numbers at the left side of the blots (unit: kD). (C and D) CFS1 localizes to the autophagosomes under control conditions. (C) Confocal microscopy images of Arabidopsis root epidermal cells co-expressing pUBQ::mCherry-CFS1 with either Golgi body marker p35S::NAG1-EGFP, trans-Golgi network marker pa1::VHAa1-GFP, late endosome marker pRPS5a::GFP-ARA7 or autophagosome marker pUBQ::GFP-ATG8A under control conditions. 5-d-old Arabidopsis seedlings were incubated in control 1/2 MS media before imaging. Representative images of 10 replicates are shown. Area highlighted in the white-boxed region in the merge panel was further enlarged and presented in the inset panel. Scale bars, 5 μm. Inset scale bars, 2 μm. (D) Quantification of confocal experiments in C showing the Mander’s colocalization coefficients between mCherry-CFS1 and the GFP-fused marker NAG1, VHAa1, ARA7, or ATG8A. M1, fraction of GFP-fused marker signal that overlaps with mCherry-CFS1 signal. M2, fraction of mCherry-CFS1 signal that overlaps with GFP-fused marker signal. Bars indicate the mean ± SD of 10 replicates. (E and F) CFS1 localizes to the autophagosomes under salt stress. (E) Confocal microscopy images of Arabidopsis root epidermal cells co-expressing pUBQ::mCherry-CFS1 with either Golgi body marker p35S::NAG1-EGFP, trans-Golgi network marker pa1::VHAa1-GFP, MVB marker pRPS5a::GFP-ARA7 or autophagosome marker pUBQ::GFP-ATG8A under salt stress. 5-d-old Arabidopsis seedlings were incubated in 150 mM NaCl-containing 1/2 MS media for 1 h for autophagy induction before imaging. Representative images of 10 replicates are shown. Area highlighted in the white-boxed region in the merge panel was further enlarged and presented in the inset panel. Scale bars, 5 μm. Inset scale bars, 2 μm. (F) Quantification of confocal experiments in E showing the Mander’s colocalization coefficients between mCherry-CFS1 and the GFP-fused marker NAG1, VHAa1, ARA7, or ATG8A. M1, fraction of GFP-fused marker signal that overlaps with mCherry-CFS1 signal. M2, fraction of mCherry-CFS1 signal that overlaps with GFP-fused marker signal. Bars indicate the mean ± SD of 10 replicates. (G and H) CFS1 does not colocalize with the endocytic marker dye FM 4-64. (G) Confocal microscopy images of Arabidopsis root epidermal cells expressing pUBQ::GFP-CFS1 and stained with FM 4-64. 5-d-old Arabidopsis seedlings were first incubated in either control or nitrogen-deficient (−N) 1/2 MS media for 4 h and were then incubated in either control or nitrogen-deficient 1/2 MS media containing 4 μΜ FM 4-64 for 30 min before imaging. Representative images of 10 replicates are shown. Area highlighted in the white-boxed region in the merge panel was further enlarged and presented in the inset panel. Scale bars, 5 μm. Inset scale bars, 2 μm. (H) Quantification of confocal experiments in G showing the Mander’s colocalization coefficients between GFP-CFS1 and FM 4-64. M1, fraction of GFP-CFS1 signal that overlaps with FM 4-64 signal. M2, fraction of FM 4-64 signal that overlaps with GFP-CFS1 signal. Bars indicate the mean ± SD of 10 replicates. (I and J) CFS1 colocalizes with the autophagosome marker proteins ATG11 and NBR1 during salt stress. (I) Confocal microscopy images of Arabidopsis root epidermal cells co-expressing pUBQ::mCherry-CFS1 with either pUBQ::GFP-ATG11 or pNBR1::NBR1-GFP. 5-d-old Arabidopsis seedlings were incubated in 150 mM NaCl-containing 1/2 MS media for 1 h for autophagy induction before imaging. Representative images of 10 replicates are shown. Area highlighted in the white-boxed region in the merge panel was further enlarged and presented in the inset panel. Scale bars, 5 μm. Inset scale bars, 2 μm. (J) Quantification of confocal experiments in I showing the Mander’s colocalization coefficients between mCherry-CFS1 and the GFP-fused marker ATG11 or NBR1. M1, fraction of GFP-fused marker signal that overlaps with mCherry-CFS1 signal. M2, fraction of mCherry-CFS1 signal that overlaps with GFP-fused marker signal. Bars indicate the mean ± SD of 10 biological replicates. Source data are available for this figure: SourceData FS1.

