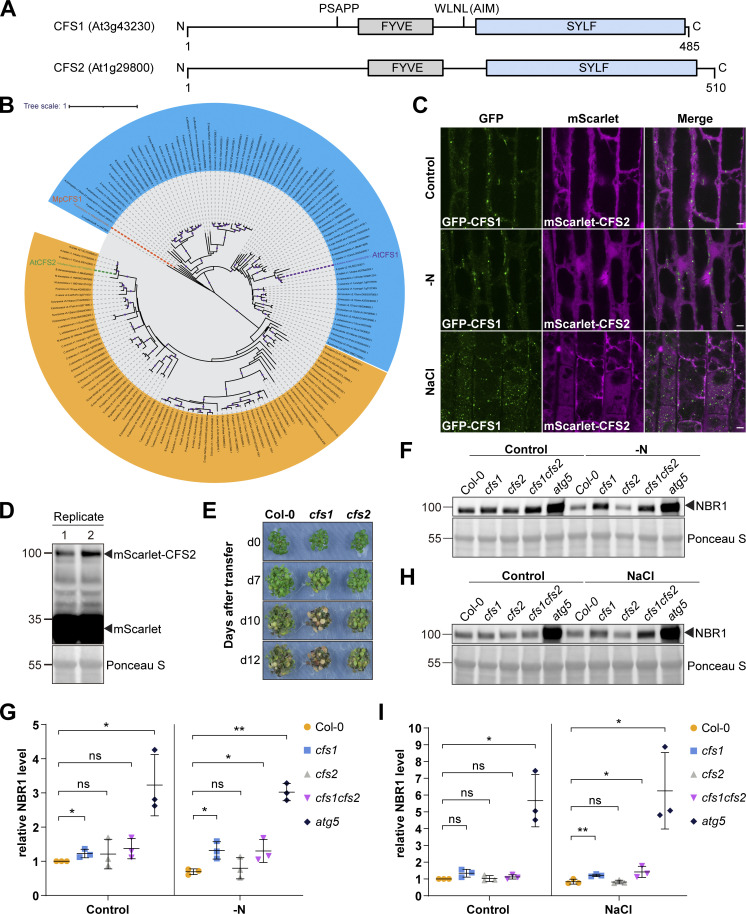
Figure S2.
CFS2 does not play a role in autophagic flux. (A) Schematic diagrams showing the domain structures of Arabidopsis CFS1 and CFS2. (B) Maximum likelihood (ML) phylogenetic tree showing that across the plant kingdom, no homology could be detected between CFS1 homologs and CFS2 homologs. Coding sequences of CFS1 and CFS2 homologs were obtained using the BLAST tool against representative species of different plant lineages in Phytozome (Goodstein et al., 2012). The tree was inferred from a 2283-nt-long alignment using the ML method and Tamura-Nei model as implemented by MEGA X (Tamura and Nei, 1993; Kumar et al., 2018). 100 bootstrap method and a discrete Gamma distribution was used to model evolutionary rate differences among sites (5 categories [+G, parameter = 0.8072]) (Felsenstein, 1985). The tree is represented using Interactive Tree Of Life (iTOL) v4 (Letunic and Bork, 2019). Best-scoring ML tree (−98686.19) is shown with purple circles indicating bootstrap values above 80 on their respective clades. The scale bar indicates the evolutionary distance based on the nucleotide substitution rate. All CFS1 homologs are grouped in the blue region while all CFS2 homologs are grouped in the orange region. Genes that encode A. thaliana CFS1 (AtCFS1), A. thaliana CFS2 (AtCFS2), and M. polymorpha CFS1 (MpCFS1) are highlighted with purple, green, and orange colors, respectively. (C) Confocal microscopy images of Arabidopsis root epidermal cells co-expressing pUBQ::GFP-CFS1 and pUBQ::mScarlet-CFS2. 5-d-old Arabidopsis seedlings were incubated in either control, nitrogen-deficient (−N) or 150 mM NaCl-containing 1/2 MS media before imaging. Representative images of 10 replicates are shown. Note that no CFS2 puncta signals could be detected. Scale bars, 5 μm. (D) Western blot analysis of Arabidopsis seedlings expressing pUBQ::mScarlet-CFS2 used in C. Total lysates were immunoblotted with anti-RFP antibodies. Images of two replicates are shown. Reference protein sizes are labeled as numbers at the left side of the blots (unit: kD). (E) Phenotypic characterization of Arabidopsis cfs1 and cfs2 mutants upon nitrogen starvation. 25 Arabidopsis seeds per genotype were first grown on 1/2 MS media plates (+1% plant agar) for 1-wk and 7-d-old seedlings were subsequently transferred to nitrogen-deficient (−N) 1/2 MS media plates (+0.8% plant agar) and grown for 2 wk. Plants were grown at 21°C under LEDs with 85 µM/m2/s and a 14 h light/10 h dark photoperiod. d0 depicts the day of transfer. Brightness of pictures was enhanced ≤19% with Adobe Photoshop (2020). Representative images of four replicates are shown. (F) Western blots showing the endogenous NBR1 level in Col-0, cfs1, cfs2, cfs1cfs2, or atg5 under control or nitrogen-starved (−N) conditions. Arabidopsis seeds were first grown in 1/2 MS media under continuous light for 1 wk and 7-d-old seedlings were subsequently transferred to control or nitrogen-deficient 1/2 MS media for 12 h. 10 μl of total seedling extract was loaded and immunoblotted with anti-NBR1 antibodies. Representative images of three replicates are shown. Reference protein sizes are labeled as numbers at the left side of the blots (unit: kD). (G) Quantification of F showing the relative NBR1 level of Col-0, cfs1, cfs2, cfs1cfs2, or atg5 under control or nitrogen-starved conditions. Values were calculated through normalization of protein bands to Ponceau S and to untreated (Control) Col-0 and shown as the mean ± SD of three replicates. One-tailed and paired Student’s t tests were performed to analyze the significance of the relative NBR1 level differences between Col-0 and each mutant. ns, not significant. *, P value <0.05. **, P value <0.01. (H) Western blot showing the endogenous NBR1 level in Col-0, cfs1, cfs2, cfs1cfs2, or atg5 under control or salt-stressed (NaCl) conditions. Arabidopsis seeds were first grown in 1/2 MS media under continuous light for 1-wk and 7-d-old seedlings were subsequently transferred to control or 150 mM NaCl-containing 1/2 MS media for 16 h. 10 μl of total seedling extract was loaded and immunoblotted with anti-NBR1 antibodies. Representative images of three replicates are shown. Reference protein sizes are labeled as numbers at the left side of the blots (unit: kD). (I) Quantification of H showing the relative NBR1 level of Col-0, cfs1, cfs2, cfs1cfs2, or atg5 under control or salt stress (NaCl) conditions. Values were calculated through normalization of protein bands to Ponceau S and to untreated (Control) Col-0 and shown as the mean ± SD of three replicates. One-tailed and paired Student’s t tests were performed to analyze the significance of the relative NBR1 level difference between Col-0 and each mutant. ns, not significant. *, P value <0.05. **, P value <0.01. Source data are available for this figure: SourceData FS2.

