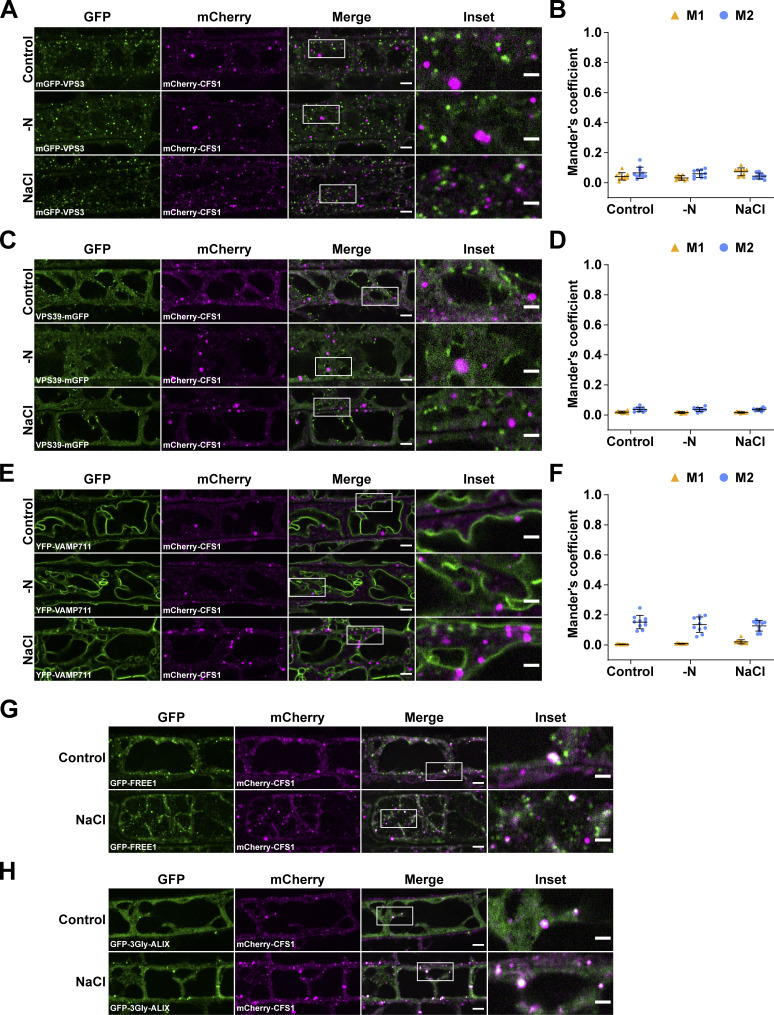
Figure S5.
CFS1 does not colocalize with VPS3, VPS39, or VAMP711, but partially colocalizes with FREE1 and ALIX. (A) Confocal microscopy images of Arabidopsis root epidermal cells co-expressing pVPS3::mGFP-VPS3 with pUBQ::mCherry-CFS1. 5-d-old Arabidopsis seedlings were incubated in either control, nitrogen-deficient (−N) or 150 mM NaCl-containing 1/2 MS media before imaging. Representative images of 10 replicates are shown. Area highlighted in the white-boxed region in the merge panel was further enlarged and presented in the inset panel. Scale bars, 5 μm. Inset scale bars, 2 μm. (B) Quantification of confocal experiments in A showing the Mander’s colocalization coefficients between mCherry-CFS1 and mGFP-VPS3. M1, fraction of mGFP-VPS3 signal that overlapped with the mCherry-CFS1 signal. M2, fraction of mCherry-CFS1 signal that overlapped with the mGFP-Vps3 signal. Bars indicate the mean ± SD of 10 replicates. (C) Confocal microscopy images of Arabidopsis root epidermal cells co-expressing pVPS39::VPS39-mGFP with pUBQ::mCherry-CFS1. 5-d-old Arabidopsis seedlings were incubated in either control, nitrogen-deficient (−N) or 150 mM NaCl-containing 1/2 MS media before imaging. Representative images of 10 replicates are shown. Area highlighted in the white-boxed region in the merge panel was further enlarged and presented in the inset panel. Scale bars, 5 μm. Inset scale bars, 2 μm. (D) Quantification of confocal experiments in C showing the Mander’s colocalization coefficients between mCherry-CFS1 and VPS39-mGFP. M1, fraction of VPS39-mGFP signal that overlapped with the mCherry-CFS1 signal. M2, fraction of mCherry-CFS1 signal that overlapped with the VPS39-mGFP signal. Bars indicate the mean ± SD of 10 replicates. (E) Confocal microscopy images of Arabidopsis root epidermal cells co-expressing pUBQ::YFP-VAMP711 with pUBQ::mCherry-CFS1. 5-d-old Arabidopsis seedlings were incubated in either control, nitrogen-deficient (−N) or 150 mM NaCl-containing 1/2 MS media before imaging. Representative images of 10 replicates are shown. Area highlighted in the white-boxed region in the merge panel was further enlarged and presented in the inset panel. Scale bars, 5 μm. Inset scale bars, 2 μm. (F) Quantification of confocal experiments in E showing the Mander’s colocalization coefficients between mCherry-CFS1 and YFP-VAMP711. M1, fraction of YFP-VAMP711 signal that overlapped with the mCherry-CFS1 signal. M2, fraction of mCherry-CFS1 signal that overlapped with the YFP-VAMP711 signal. Bars indicate the mean ± SD of 10 replicates. (G) Representative confocal microscopy images showing the colocalization of p35S::GFP-FREE1 and pUBQ::mCherry-CFS1 in Arabidopsis root epidermal cells. 5-d-old Arabidopsis seedlings were incubated in either control or 150 mM NaCl-containing 1/2 MS media for 1 h before imaging. Area highlighted in the white-boxed region in the merge panel was further enlarged and presented in the inset panel. Scale bars, 5 μm. Inset scale bars, 2 μm. (H) Representative confocal microscopy images showing the colocalization of pALIX::GFP-3Gly-ALIX and pUBQ::mCherry-CFS1 in Arabidopsis root epidermal cells. 5-d-old Arabidopsis seedlings were incubated in either control or 150 mM NaCl-containing 1/2 MS media for 1 h before imaging. Area highlighted in the white-boxed region in the merge panel was further enlarged and presented in the inset panel. Scale bars, 5 μm. Inset scale bars, 2 μm.

