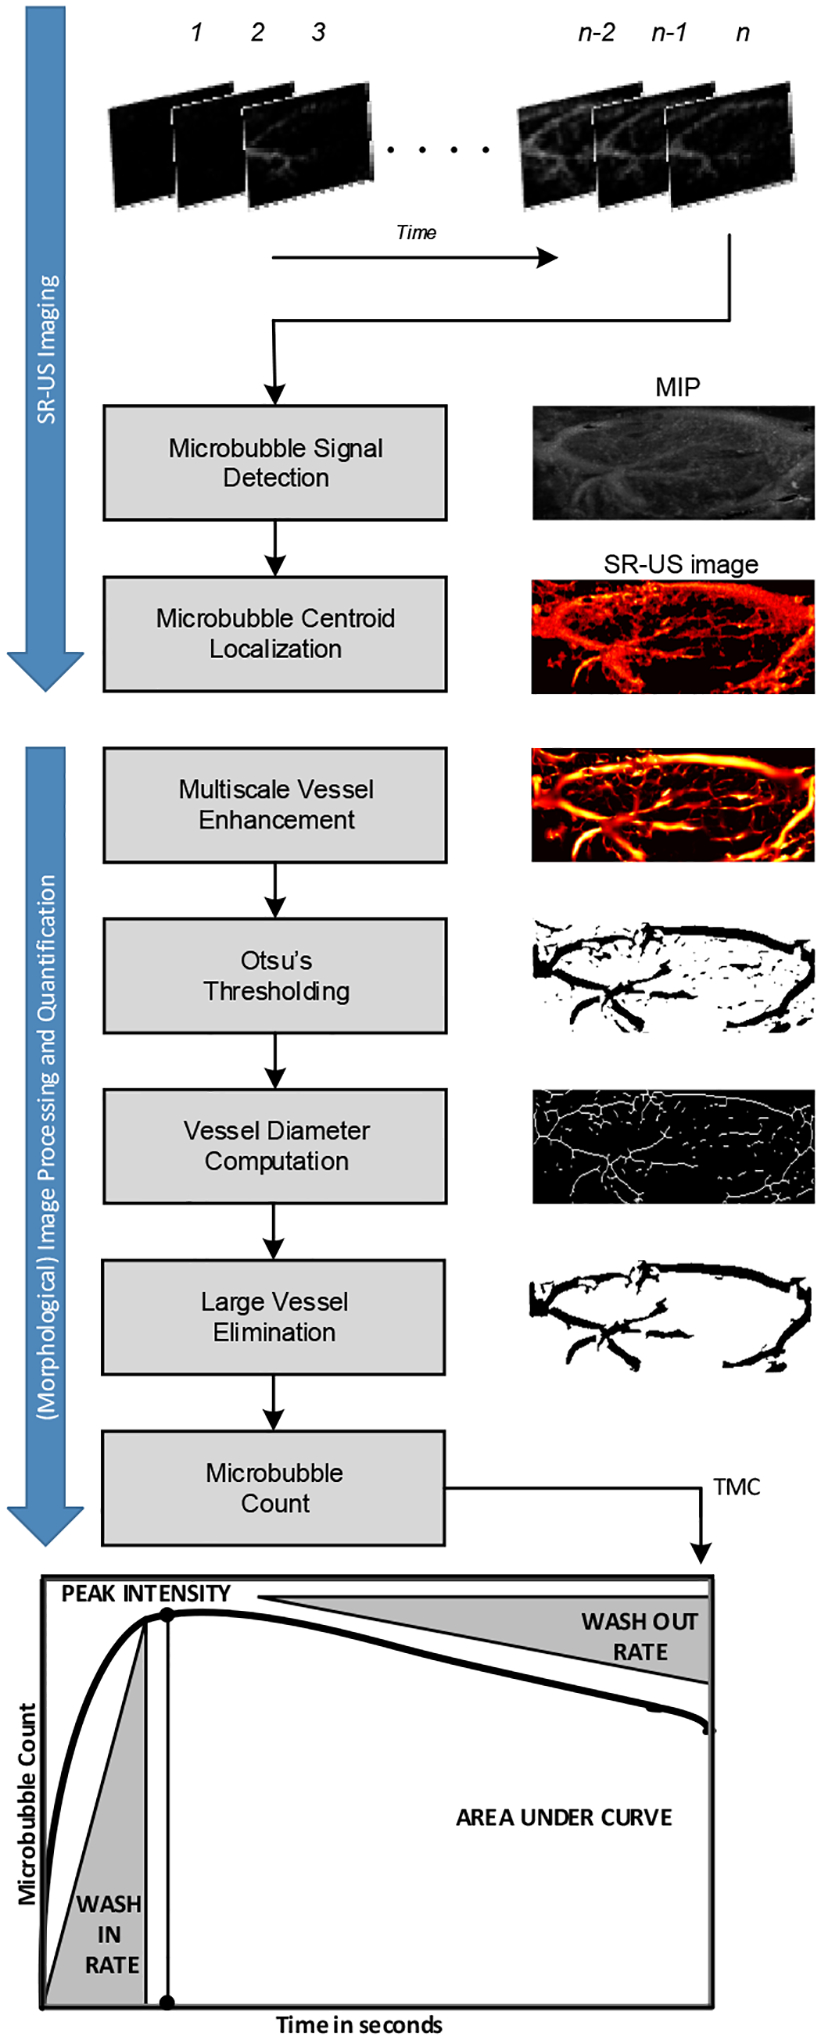
Figure 1.

Summary of the image processing steps and resulting images from each step for analysis of perfusion parameters area under the curve (AUC), peak intensity (IPK), wash-in rate (WIR), and wash-out rate (WOR) derived from the time microbubble count curve.
