Figure 4.

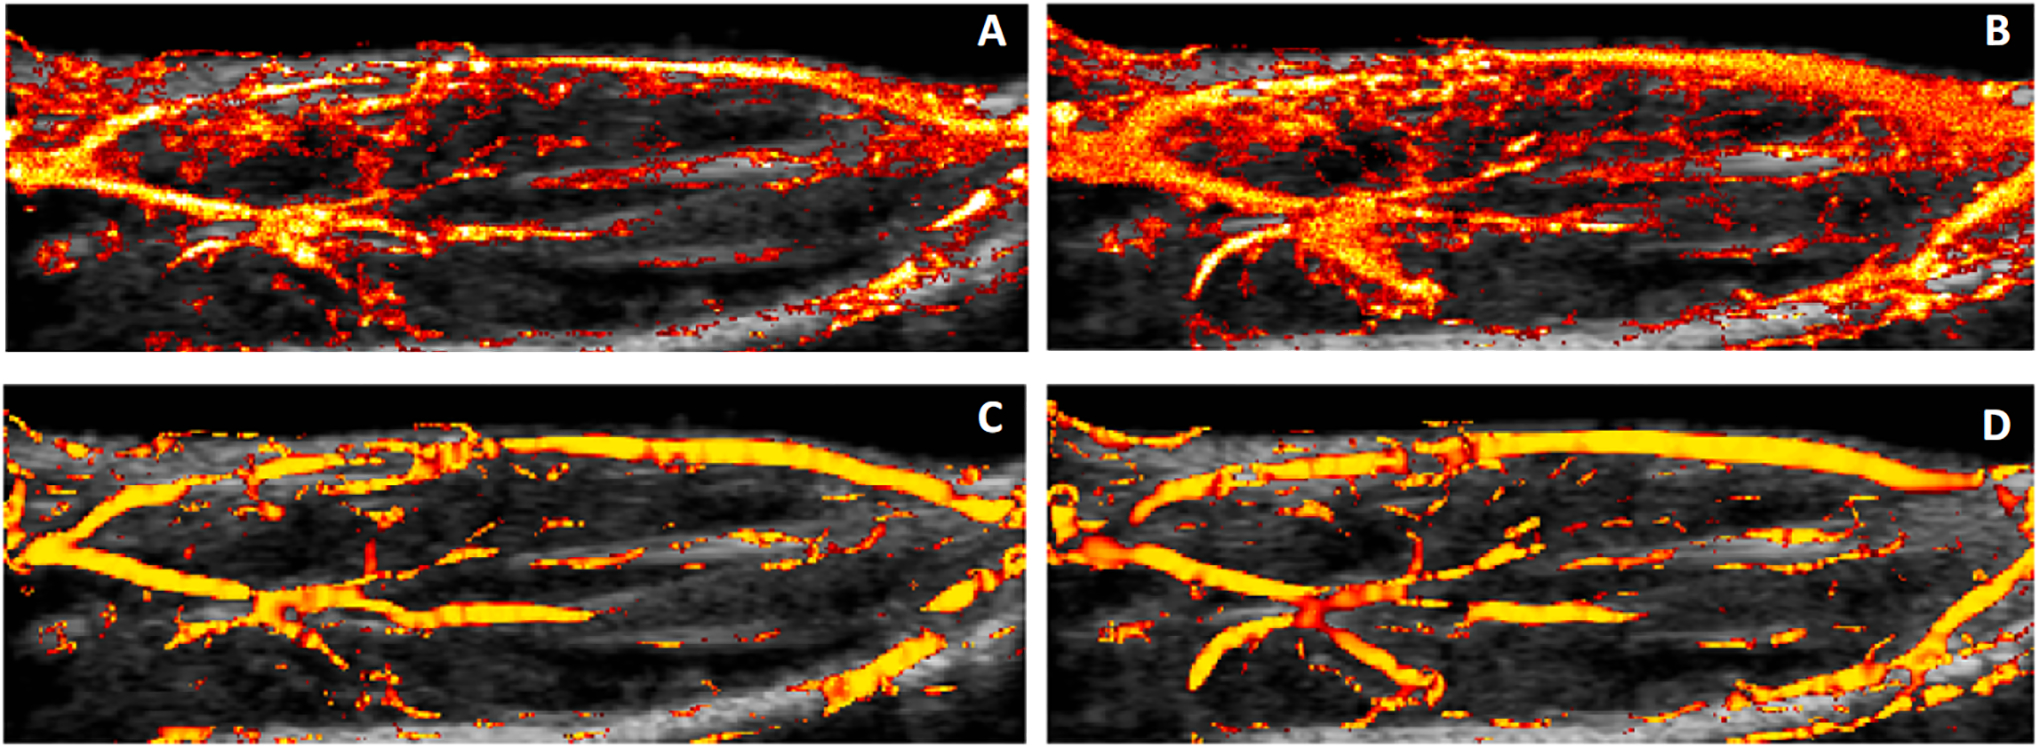
SR-US images of a representative lean subject at baseline (A) and 1h (B) after insulin/glucose injection. Image (C) and (D) show the detection of the large vessels from (A) and (B) respectively.

SR-US images of a representative lean subject at baseline (A) and 1h (B) after insulin/glucose injection. Image (C) and (D) show the detection of the large vessels from (A) and (B) respectively.