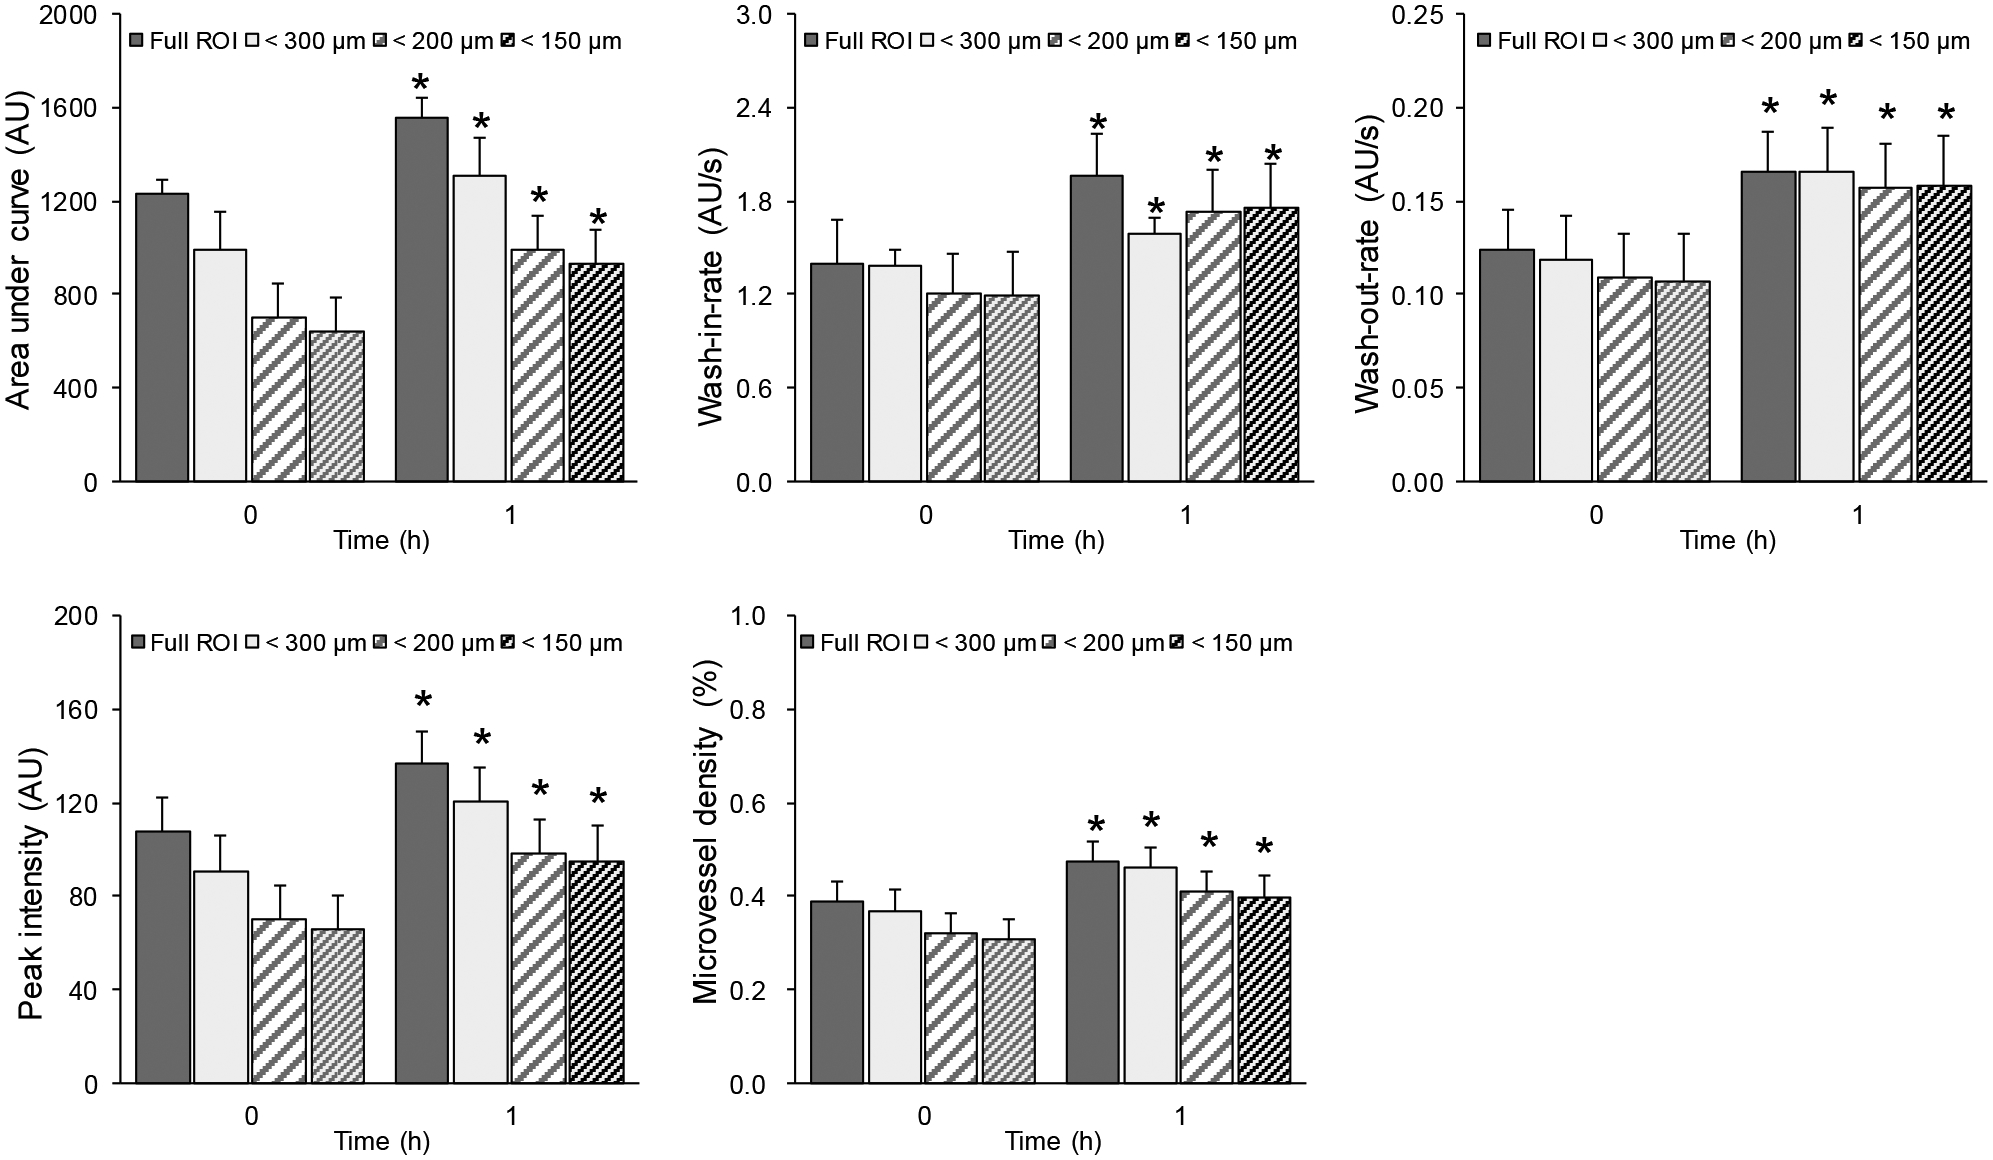
Figure 7.

Summary of skeletal muscle parametric measurements characterizing the insulin-induced microvascular response or dysfunction derived from SR-US imaging data collected in lean animals. Absolute changes in perfusion parameters from the lean group when using full ROI, restricted ROI for vessels smaller than 300 μm, 200 μm, and 150 μm in diameter. A * denotes p < 0.01. Using restricted ROIs, significant changes in longitudinal measurements were preserved.
