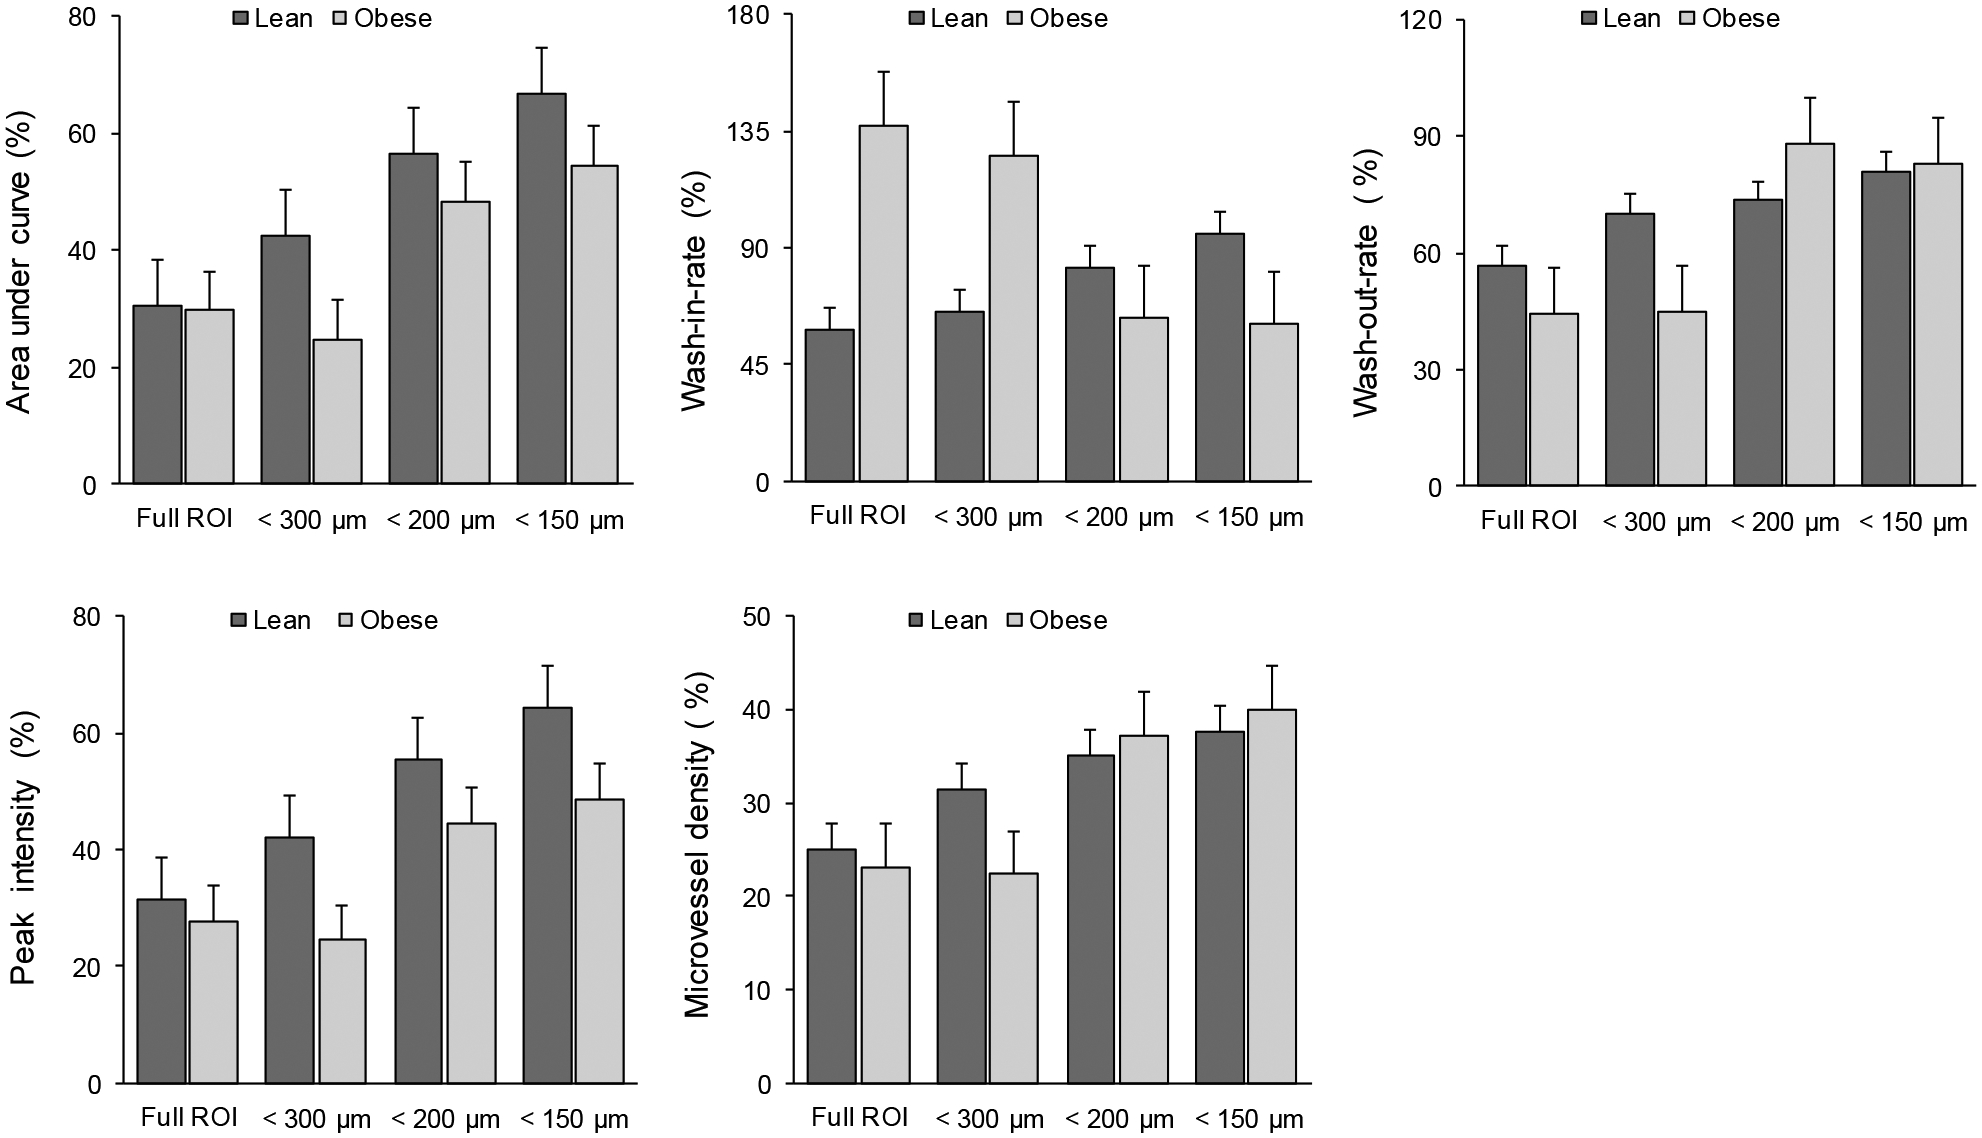
Figure 8.

Relative changes in perfusion parameters compared with different mice groups (lean and obese) and using different ROIs. Bar graphs detail the percentage changes relative to baseline measures for AUC, WIR, WOR, IPK, and MVD parameters. Note the increased changes of AUC and IPK in lean group compared to obese group when using restricted ROIs.
