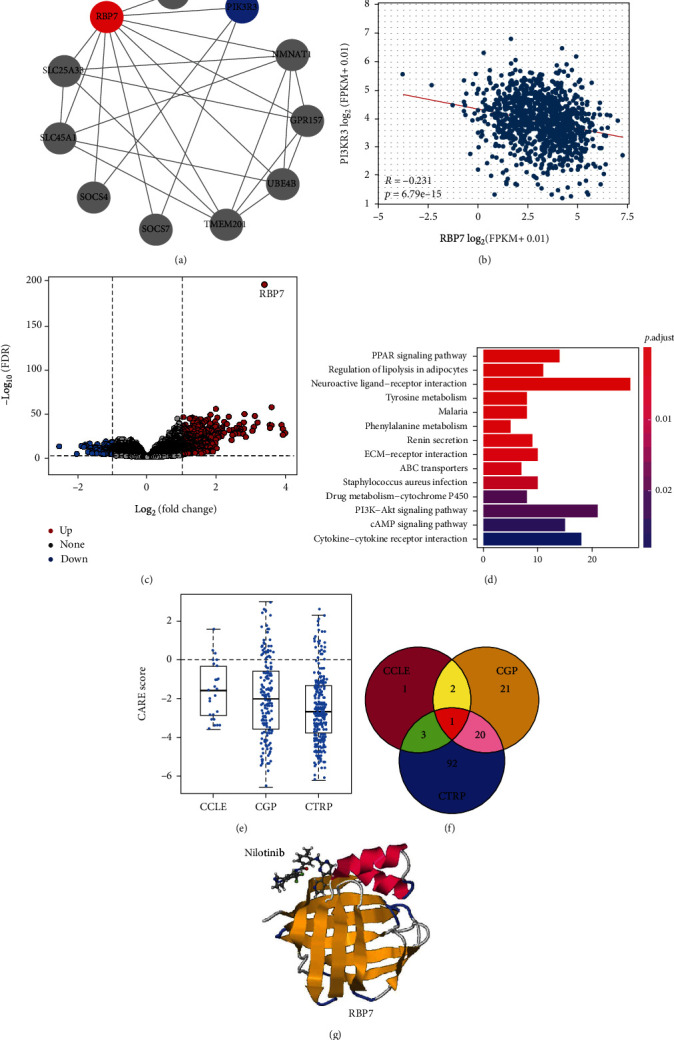
Figure 7.

Analysis of the potential regulatory functions and RBP7-targeting drugs for breast cancer. (a) The PPI network for RBP7 and its coexpressed genes by STRING. (b) Correlation analysis of RBP7 and PIK3R3. (c) Volcano plot showing the differentially expressed genes in ER+ breast cancer with high or low expression of RBP7. (d) KEGG pathway analysis of DEGs in ER+ breast cancer with high or low expression of RBP7. (e) CARE analysis of the resistance module gene RBP7 in the CCLE, CTRP and CGP databases. (f) Venn diagram showing the overlap of the RBP7-targeting drugs in the 3 databases. (g) Prediction of the binding sites between nilotinib and RBP7.
