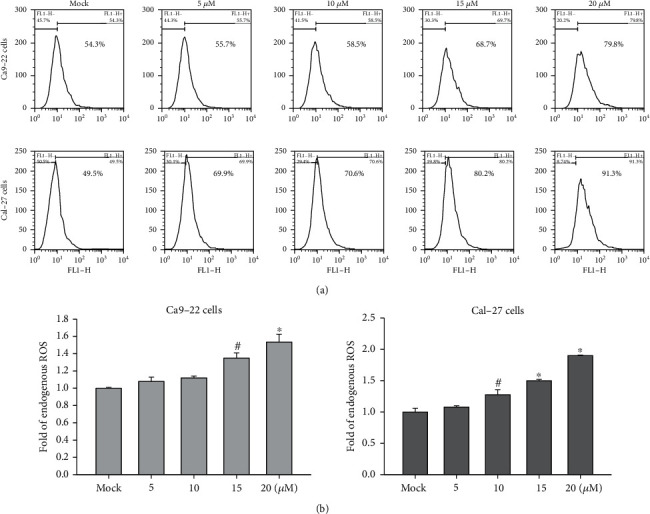
Figure 4.

Flow cytometry analysis of ROS changes in oral cancer cells following 4-carbomethoxyl-10-epigyrosanoldie E treatment. (a) ROS levels in Ca9-22 and Cal-27 cells treated with different concentrations of 4-carbomethoxyl-10-epigyrosanoldie E, measured by flow cytometry. (b) Quantification of ROS levels in the experiment groups as compared with the mock control. #p < 0.05, ∗p < 0.001.
