
Figure 2.
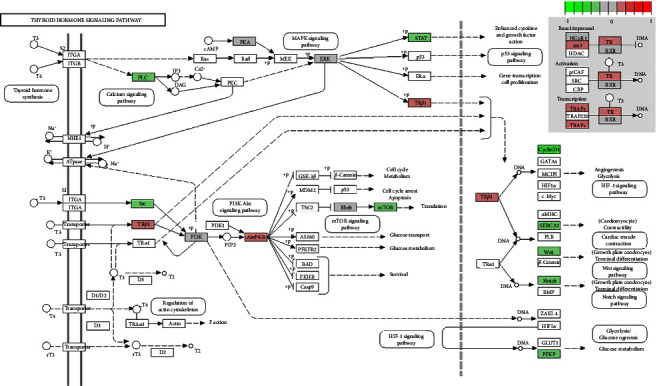
Changes in the expression of target genes of the thyroid hormone signaling pathway in patients with NAFLD. The changes are mapped with colors. The color depth positively correlated with the degree value. Red indicates increased expression, while green indicates decreased gene expression in the NAFLD group when compared with the healthy obese group.