Figure 4.

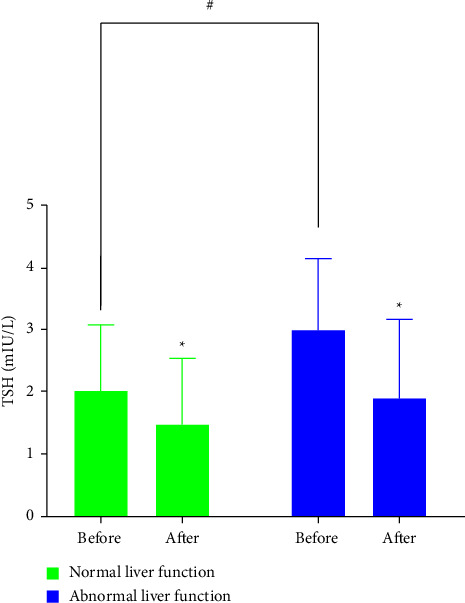
Concentration of TSH before and after liraglutide treatment stratified by status of liver disease. ∗p < 0.05 vs. corresponding baseline data; #p < 0.05 vs. baseline normal liver function group.

Concentration of TSH before and after liraglutide treatment stratified by status of liver disease. ∗p < 0.05 vs. corresponding baseline data; #p < 0.05 vs. baseline normal liver function group.