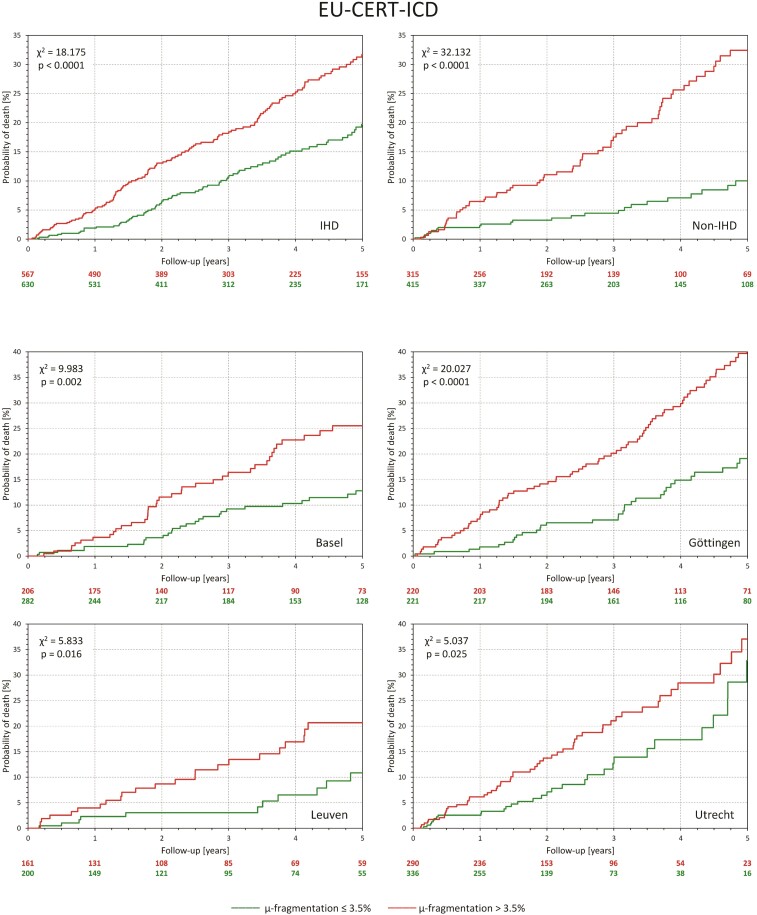
Figure 3.
All panels show Kaplan–Meier probabilities of death in different subgroups of the EU-CERT-ICD population. Green and red lines correspond to patients with QRS micro-fragmentation ≤3.5 and >3.5%, respectively. The top two panels show sub-populations with ischaemic heart disease and non-ischaemic heart disease. The bottom four panels correspond to the sub-populations of four different centres that contributed more than 100 patients. Numbers of patients at risk are shown below each panel in corresponding colours. The non-survival probabilities were compared by log-rank test.

