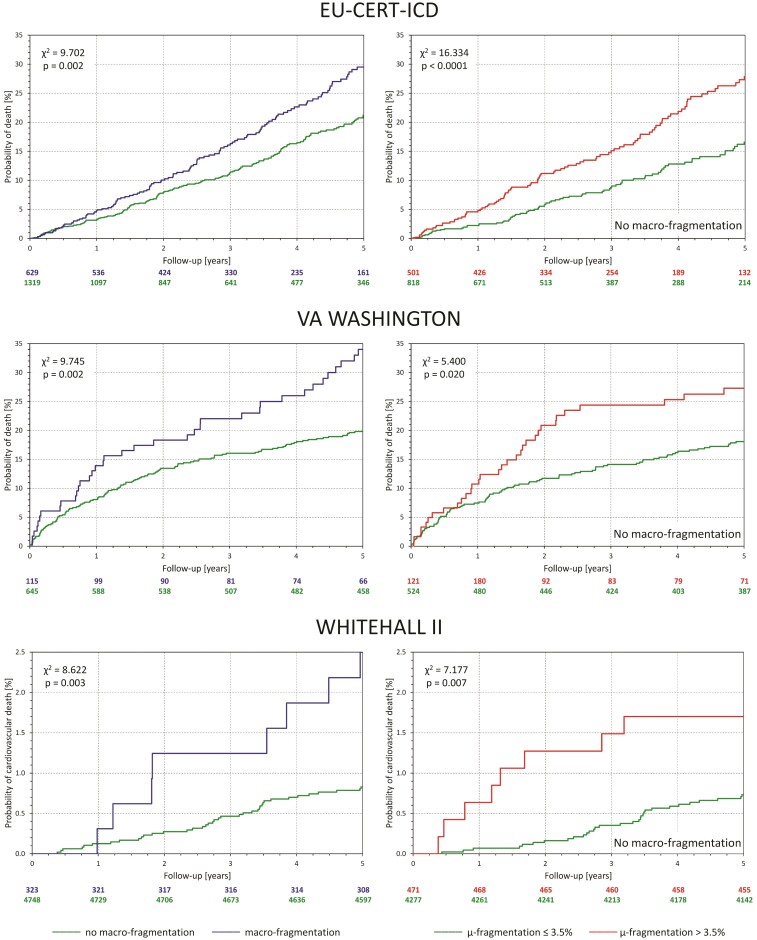
Figure 5.
For each of the investigated populations, the panel on the left shows Kaplan–Meier probabilities of non-survival for subjects with (blue line) and without observed QRS macro-fragmentation (green line). The panels on the right show Kaplan–Meier probabilities of non-survival in subjects without QRS macro-fragmentation stratified by QRS micro-fragmentation above (red line) and below (green line) of the 3.5% dichotomy. Numbers of patients at risk are shown below each panel in corresponding colours. The non-survival probabilities were compared by log-rank test.

