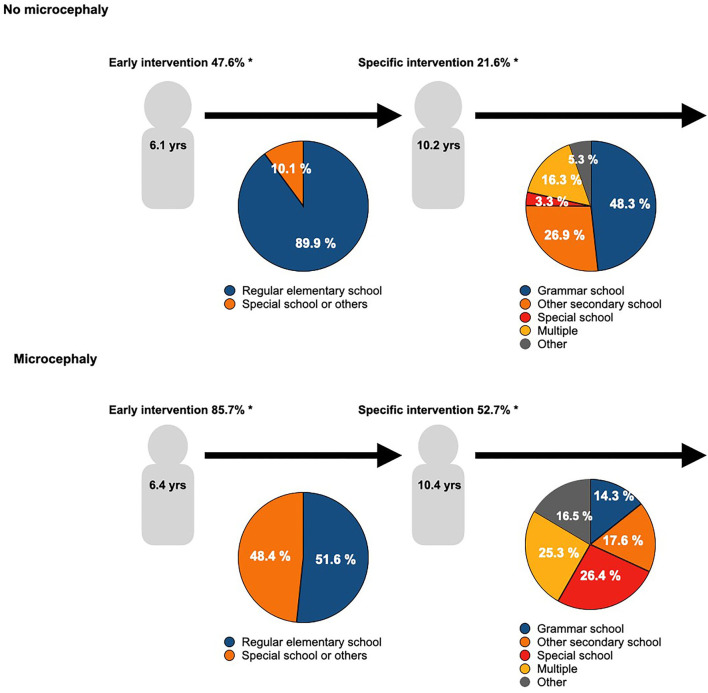
Figure 4.
Educational development in CHD patients. The graph visualizes the school career of CHD patients with or without microcephaly. The median age of school enrollment and the first change of school are given in the figures. The distribution of different kinds of primary schools in the left pie chart is represented, and the pie chart on the right represents the different kinds of secondary schools. Further, the usage of early and/ or specific interventions to support the school careers is given. Differences in the kind of school are significant < 0.001; additionally * denotes a significant difference compared to non-microcephalic patients, p < 0.001, and + denotes p < 0.05.

